
Page 48 - Application Notebook - Solution for Food Development
P. 48
Application No.C132
News
n Comparison of Sugars (Flesh and Peel) n Comparison of Citrus Fruits (Flesh)
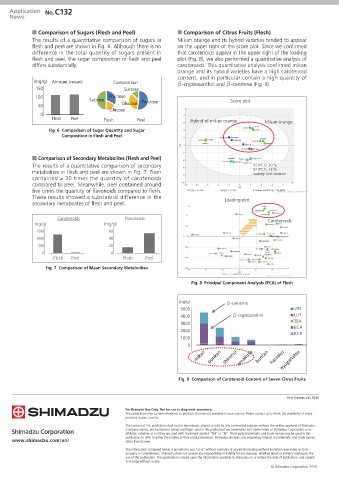
The results of a quantitative comparison of sugars in Mikan orange and its hybrid varieties tended to appear
flesh and peel are shown in Fig. 6. Although there is no on the upper right of the score plot. Since we confirmed
difference in the total quantity of sugars present in that carotenoids appear in the upper right of the loading
flesh and peel, the sugar composition of flesh and peel plot (Fig. 8), we also performed a quantitative analysis of
differs substantially. carotenoids. This quantitative analysis confirmed mikan
orange and its hybrid varieties have a high carotenoid
content, and in particular contain a high quantity of
(mg/g) Amount (mean) Composition β-cryptoxanthin and β-carotene (Fig. 9).
150 Sucrose
100 Fructose
Sucrose Fructose Score plot
50 Glucose
Glucose
0
Flesh Peel Flesh Peel Hybrid of mikan orange Mikan orange
Fig. 6 Comparison of Sugar Quantity and Sugar
Composition in Flesh and Peel
n Comparison of Secondary Metabolites (Flesh and Peel)
The results of a quantitative comparison of secondary R2 (PC1): 30 %
metabolites in flesh and peel are shown in Fig. 7. Flesh R2 (PC2): 23 %
Scaling: Unit variance
contained ≥ 30 times the quantity of carotenoids
compared to peel. Meanwhile, peel contained around
five times the quantity of flavonoids compared to flesh.
These results showed a substantial difference in the
secondary metabolites of flesh and peel. Loading plot
$BSPUFOPJET 'MBWPOPJET Carotenoids
OH H NH H
'MFTI 1FFM 'MFTI 1FFM
Fig. 7 Comparison of Mean Secondary Metabolites
Fig. 8 Principal Component Analysis (PCA) of Flesh
(ng/g) Ќ-carotene
5000 VIO
4000 Ќ-cryptoxanthin LUT
ZEA
3000
BCA
2000
BCR
1000
0
Fig. 9 Comparison of Carotenoid Content of Seven Citrus Fruits
First Edition: Jul. 2016
For Research Use Only. Not for use in diagnostic procedure.
This publication may contain references to products that are not available in your country. Please contact us to check the availability of these
products in your country.
The content of this publication shall not be reproduced, altered or sold for any commercial purpose without the written approval of Shimadzu.
Company names, product/service names and logos used in this publication are trademarks and trade names of Shimadzu Corporation or its
affiliates, whether or not they are used with trademark symbol “TM” or “®”. Third-party trademarks and trade names may be used in this
publication to refer to either the entities or their products/services. Shimadzu disclaims any proprietary interest in trademarks and trade names
www.shimadzu.com/an/ other than its own.
The information contained herein is provided to you "as is" without warranty of any kind including without limitation warranties as to its
accuracy or completeness. Shimadzu does not assume any responsibility or liability for any damage, whether direct or indirect, relating to the
use of this publication. This publication is based upon the information available to Shimadzu on or before the date of publication, and subject
to change without notice.
© Shimadzu Corporation, 2016