
Page 49 - Application Notebook - PFAS Analysis
P. 49
No. SSI-LCMS-121
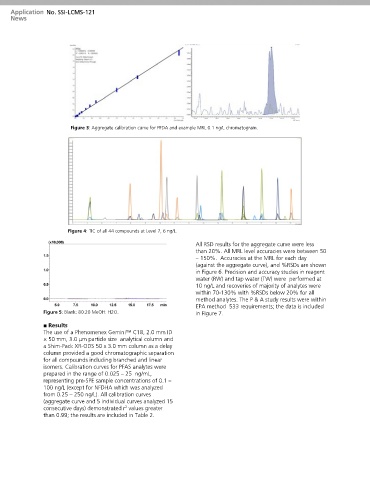
Figure 3: Aggregate calibration curve for PFDA and example MRL 0.1 ng/L chromatogram.
Figure 4: TIC of all 44 compounds at Level 7, 6 ng/L.
All RSD results for the aggregate curve were less
than 20%. All MRL level accuracies were between 50
– 150%. Accuracies at the MRL for each day
(against the aggregate curve), and %RSDs are shown
in Figure 6. Precision and accuracy studies in reagent
water (RW) and tap water (TW) were performed at
10 ng/L and recoveries of majority of analytes were
within 70-130% with %RSDs below 20% for all
method analytes. The P & A study results were within
EPA method 533 requirements; the data is included
Figure 5: Blank: 80:20 MeOH: H2O. in Figure 7.
■ Results
The use of a Phenomenex Gemini™ C18, 2.0 mm ID
× 50 mm, 3.0 μm particle size analytical column and
a Shim-Pack XR-ODS 50 x 3.0 mm column as a delay
column provided a good chromatographic separation
for all compounds including branched and linear
isomers. Calibration curves for PFAS analytes were
prepared in the range of 0.025 – 25 ng/mL,
representing pre-SPE sample concentrations of 0.1 –
100 ng/L (except for NFDHA which was analyzed
from 0.25 – 250 ng/L). All calibration curves
(aggregate curve and 5 individual curves analyzed 15
consecutive days) demonstrated r values greater
2
than 0.99; the results are included in Table 2.