
Page 9 - Solutions for Plastic Evaluation
P. 9
Structure and Copolymers Evaluation of Raw Materials
FTIR
Quantitation of Vinyl Acetate in EVA
The copolymer ethylene-vinyl acetate (EVA) offers good clarity and is used for a wide variety of products, such as fertilizer bags, wrapping
film, bottles, and tubes. Increasing the content of vinyl acetate in EVA increases its elasticity and thermal plasticity. Though there are several Plastic Materials Evaluation of
methods available for quantitating the content of vinyl acetate in EVA, infrared spectrophotometry is easier and faster because analysis can
be performed without pretreating samples. Raw Materials Evaluation of
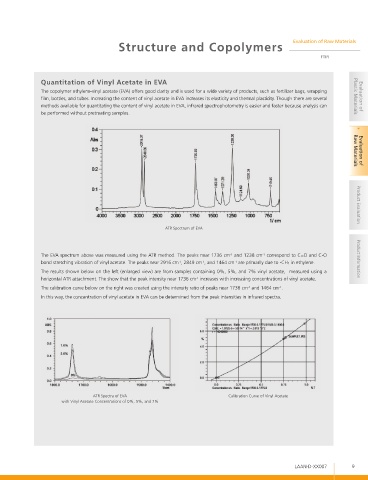
ATR Spectrum of EVA Product Evaluation
The EVA spectrum above was measured using the ATR method. The peaks near 1736 cm and 1238 cm correspond to C=O and C-O
-1
-1
bond stretching vibration of vinyl acetate. The peaks near 2916 cm , 2849 cm , and 1464 cm are primarily due to -CH2 in ethylene. Product Information
-1
-1
-1
The results shown below on the left (enlarged view) are from samples containing 0%, 5%, and 7% vinyl acetate, measured using a
horizontal ATR attachment. The show that the peak intensity near 1736 cm increases with increasing concentrations of vinyl acetate.
-1
The calibration curve below on the right was created using the intensity ratio of peaks near 1736 cm and 1464 cm .
-1
-1
In this way, the concentration of vinyl acetate in EVA can be determined from the peak intensities in infrared spectra.
ATR Spectra of EVA Calibration Curve of Vinyl Acetate
with Vinyl Acetate Concentrations of 0%, 5%, and 7%
LAAN-D-XX007 9