
Page 14 - Solutions for Plastic Evaluation
P. 14
Evaluation of Raw Materials
Additives
MALDI-TOFMS
Evaluation of Plastic Materials Analysis of Additives in Acrylic Sheets
Polymer materials degrade due to a variety of factors, including light, heat, mechanical and electrical factors, radiation, chemicals, and
moisture. Many different additives, such as antioxidants, UV absorbers, hindered amine light stabilizers (HALS), and thermal stabilizers,
have been developed to prevent such degradation and maintain the desired characteristics of the polymer material. The quantity of each
additive used varies depending on the specific purpose of the polymer material, but generally is in ultra trace quantities of about 1%
(w/w) or less. Even for the same polymer material, the type of additive can vary depending on the grade or manufacturer. Consequently,
analyzing the additives in polymer materials is extremely important for investigating or improving the performance of various polymer
materials.
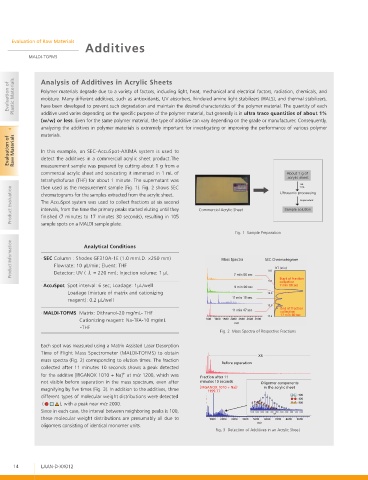
Evaluation of Raw Materials In this example, an SEC-AccuSpot-AXIMA system is used to
detect the additives in a commercial acrylic sheet product.The
measurement sample was prepared by cutting about 1 g from a
commercial acrylic sheet and sonicating it immersed in 1 mL of "CPVU H PG
BDSZMJD TIFFU
tetrahydrofuran (THF) for about 1 minute. The supernatant was
THF
then used as the measurement sample (Fig. 1). Fig. 2 shows SEC
1 mL
Product Evaluation chromatograms for the samples extracted from the acrylic sheet. Commercial Acrylic Sheet 4BNQMF TPMVUJPO
6MUSBTPOJD QSPDFTTJOH
Supernatant
The AccuSpot system was used to collect fractions at six second
intervals, from the time the primary peaks started eluting until they
finished (7 minutes to 17 minutes 30 seconds), resulting in 105
sample spots on a MALDI sample plate.
Fig. 1 Sample Preparation
Product Information ∙ SEC Column : Shodex GF310A-1E (1.0 mmI.D. ×250 mm) Mass Spectra SEC Chromatogram
Analytical Conditions
Flowrate: 10 µL/min; Eluent: THF
RT (min)
0.0
Detector: UV ( λ = 220 nm); Injection volume: 1 µL
7 min 00 sec
5.0 Start of fraction
collection
∙ AccuSpot Spot interval: 6 sec; Loadage: 1µL/well 9 min 00 sec 7 min 00 sec
Loadage (mixture of matrix and cationizing 10.0
reagent): 0.2 µL/well 11 min 10 sec
15.0
11 min 47 sec End of fraction
∙ MALDI-TOFMS Matrix: Dithranol-20 mg/mL- THF collection
17 min 30 sec
17.5
Cationizing reagent: Na-TFA-10 mg/mL 500 1000 1500 2000 2500 3000 3500
m/z
-THF
Fig. 2 Mass Spectra of Respective Fractions
Each spot was measured using a Matrix Assisted Laser Desorption
Time of Flight Mass Spectrometer (MALDI-TOFMS) to obtain
X5
mass spectra (Fig. 2) corresponding to elution times. The fraction
Before separation
collected after 11 minutes 10 seconds shows a peak detected
+
for the additive [IRGANOX 1010 + Na] at m/z 1200, which was Fraction after 11
not visible before separation in the mass spectrum, even after minutes 10 seconds Oligomer components
magnifying by five times (Fig. 3). In addition to the additives, three [IRGANOX 1010 + Na] + in the acrylic sheet
1199.77
different types of molecular weight distributions were detected :100
:100
( ), with a peak near m/z 2000. :100
Since in each case, the interval between neighboring peaks is 100, 1400 1600 1800 2000 2200 2400 2600 2800 3000 3200 3400
m/z
these molecular weight distributions are presumably all due to 1000 2000 3000 4000 5000 6000 7000 8000 9000
m/z
oligomers consisting of identical monomer units.
Fig. 3 Detection of Additives in an Acrylic Sheet
14 LAAN-D-XX012