
Page 13 - Electric&Electronics - Total Solution for Analyzing Electronic Devices
P. 13
Comprehensive Quantitation Functions
Evaluation of Optical Properties
Evaluation of Film Thickness Measurement of Re ectance and Transmittance
Infrared Spectrophotometer ● Measurement of Antire ection Coating Re ectance
IRSpirit Series / IRAf nity-1S / IRTracer-100
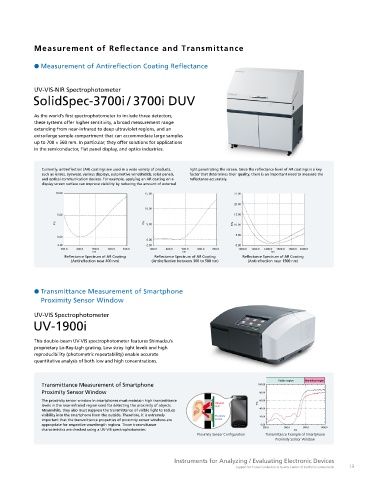
● Quantitative Measurement of Phosphorus and Boron in Silicon Wafers by the PLS Method UV-VIS-NIR Spectrophotometer
SolidSpec-3700i / 3700i DUV
IRSpirit series, IRAffinity-1S, and IRTracer-100 spectrophotometers
have earned an excellent reputation for use in a wide variety of As the world’s rst spectrophotometer to include three detectors,
structural analysis and non-destructive measurement applications, these systems offer higher sensitivity, a broad measurement range
such as for qualitative analysis of defect locations on IC chips or extending from near-infrared to deep ultraviolet regions, and an
other small parts in the electronic/electrical/semiconductor eld. extra-large sample compartment that can accommodate large samples
up to 700 × 560 mm. In particular, they offer solutions for applications
The infrared spectrum from transmission through a silicon wafer in the semiconductor, at panel display, and optics industries.
that contains phosphorus and boron as a dopant shows a peak at
1100 cm due to Si-O stretching vibration. However, it is dif cult to
-1
quantify both the phosphorus and boron at the same time, due to Currently, antire ection (AR) coatings are used in a wide variety of products, light penetrating the screen. Since the re ectance level of AR coatings is a key
the P-O stretching vibration peak that should be visible at 1330 cm Quantitative Calculation Results such as lenses, eyewear, various displays, automotive windshields, solar panels, factor that determines their quality, there is an important need to measure the
-1
being obscured by an overlapping B-O band peak centered at 1390 Table 1 Quantitative Calculation Results by the PLS I Method and optical communication devices. For example, applying an AR coating on a re ectance accurately.
display screen surface can improve visibility by reducing the amount of external
cm . However, by using PLS quantitative calculation software with a
-1
Fourier transform infrared spectrophotometer, both can be 10.00 15.00 25.00
quanti ed at the same time by the PLS method, an advanced version
20.00
of principal component analysis (PCA), as shown in the table. (The 10.00
table shows a comparison of concentrations in a solution from a 5.00 15.00
silicon wafer dissolved in acid, measured using a high-frequency R%
plasma emission spectrometer.) The system can also be used to R% 5.00 R% 10.00
predict the thickness of silicon wafers used as samples. 5.00
0.00
0.00
-2.00 -2.00 0.00
300.0 400.0 500.0 600.0 700.0 300.0 400.0 500.0 600.0 700.0 1000.0 1200.0 1400.0 1600.0 1800.0 2000.0
Infrared Spectrum of a nm nm nm
Silicon Wafer Re ectance Spectrum of AR Coating Re ectance Spectrum of AR Coating Re ectance Spectrum of AR Coating
(Antire ection near 400 nm) (Antire ection between 300 to 500 nm) (Antire ection near 1500 nm)
● Transmittance Measurement of Smartphone
Proximity Sensor Window
UV-VIS Spectrophotometer
● Measurement of Fluoropolymer Film Thickness on Hard Drive Discs UV-1900i
Infrared Spectrum of Fluoropolymer Calibration Curve for Fluoropolymer Film
The disc surfaces in computer internal hard drives are coated with a on a Hard Drive Disc Thickness on Hard Drive Disc This double-beam UV-VIS spectrophotometer features Shimadzu’s
uoropolymer as a lubricant. High-sensitivity re ection absorption 0.08
ABS 50.0 proprietary Lo-Ray-Ligh grating. Low stray light levels and high
spectroscopy (RAS) is an effective method for measuring the 0.075 Å Wavenumber range:
0.07 40.0 1200 to 1350 cm -1 reproducibility (photometric repeatability) enable accurate
thickness of uoropolymer lm coatings. At incident angles of 70
0.065 30.0 quantitative analysis of both low and high concentrations.
degrees or more, thin lms less than 1.0 m thick can be measured. 0.06
20.0
0.055
0.05 10.0
1600 1550 1500 1450 1400 1350 1300 1250 1200 1150 1100 1050 1000 0.2 0.25 0.3 0.35 0.4 0.45 0.5 0.55 0.6 0.65 0.7 0.75 0.8 0.85 Visible region Near-infrared region
1/cm 1/cm*ABS Transmittance Measurement of Smartphone 100.00
Proximity Sensor Window 80.00
● Measurement of Epitaxial Film Thickness on Silicon Wafer
The proximity sensor window in smartphones must maintain high transmittance T% 60.00
levels in the near-infrared region used for detecting the proximity of objects. Infrared
LED
Using a Fourier transform infrared (FTIR) spectrophotometer, the Meanwhile, they also must suppress the transmittance of visible light to reduce 40.00
lm thickness can be calculated from the interference fringe visibility into the smartphone from the outside. Therefore, it is extremely Proximity 20.00
important that the transmittance properties of proximity sensor windows are sensor
spectrum based on the equation to the right, where n is the sample Δm 1 appropriate for respective wavelength regions. Those transmittance 0.00
refractive index, Θ is the infrared light angle of incidence onto the d 2 n -Sin θ ( ) characteristics are checked using a UV-VIS spectrophotometer. 380.0 600.0 nm 800.0 1000.0
2
2
sample, m is the number of peaks or valleys within the ν 1 -ν 2 Proximity Sensor Con guration Transmittance Example of Smartphone
Proximity Sensor Window
wavenumber range being calculated, and ν1 and ν2 are the
maximum and minimum values within the wavenumber range.
12 13