Page 10 - Electric&Electronics - Total Solution for Analyzing Electronic Devices
P. 10

Observation and Analysis/Evaluation


                                                                                                                                      Elemental Analysis and Contaminant Analysis


            ● Non-Destructive 3D Measurement of Plastic Connectors and Other Molded Parts                                             ● Identi cation of Organic Matter and Analysis of Contaminants on Electronic Components


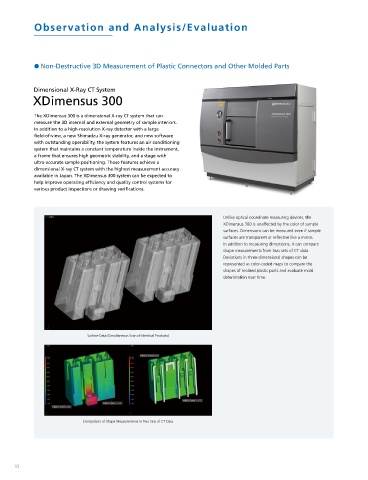
            Dimensional X-Ray CT System                                                                                               Automatic Failure Analysis System
            XDimensus 300                                                                                                             IRTracer-100 + AIM-9000


            The XDimensus 300 is a dimensional X-ray CT system that can                                                               Using an infrared microscope is one of the most effective ways to identify organic
            measure the 3D internal and external geometry of sample interiors.                                                        contaminant matter originating from raw materials used in manufacturing processes
            In addition to a high-resolution X-ray detector with a large                                                              or from dust in the atmosphere. In this example, a contaminant attached to the
             eld-of-view, a new Shimadzu X-ray generator, and new software                                                            terminal of an electronic component was analyzed. Using a camera with a large
            with outstanding operability, the system features an air conditioning                                                      eld-of-view allows all steps from observing the overall component to deciding
            system that maintains a constant temperature inside the instrument,                                                       measurement locations to be accomplished smoothly. The ATR method (with a Ge
            a frame that ensures high geometric stability, and a stage with                                                           prism) can provide an effective way to measure thin stains, small contaminants, and
            ultra-accurate sample positioning. Those features achieve a                                                               other substances from which good re ectance spectra are dif cult to obtain.
            dimensional X-ray CT system with the highest measurement accuracy
            available in Japan. The XDimensus 300 system can be expected to
            help improve operating ef ciency and quality control systems for                                                                                                            0.125
            various product inspections or drawing veri cations.                                                                                                                        0.100

                                                                                                                                                                                        0.075
                                                                                                                                                                                        Abs
                                                                                                                                                                                        0.050
                                                                                                                                                                                        0.025
                                                                           Unlike optical coordinate measuring devices, the
                                                                           XDimensus 300 is unaffected by the color of sample                                                             0
                                                                                                                                         Observation Image of the  Observation Image of Contaminant  4000  3600  3200  2800  2400  2000  1800  1600  1400  1200  1000  800cm -1
                                                                           surfaces. Dimensions can be measured even if sample
                                                                                                                                         Entire Electronic Component  on Terminal Magnified by 15x with  Reflection Mode Spectrum of Contaminant Identified as Silicate
                                                                           surfaces are transparent or re ective like a mirror.          via Wide-View Camera  Cassegrain Mirror
                                                                           In addition to measuring dimensions, it can compare
                                                                           shape measurements from two sets of CT data.
                                                                           Deviations in three-dimensional shapes can be
                                                                           represented as color-coded maps to compare the                Example of Electronic Circuit Board Failure Analysis  ̶ Imaging with an AIM-9000 Infrared Microscope ̶
                                                                           shapes of molded plastic parts and evaluate mold
                                                                           deterioration over time.                                      The microscope re ection method was used for imaging analysis of a relatively large range.
                                                                                                                                         An area 200 µm tall by 325 µm wide was measured.

                                                                                                                                                                                         0.7                  Paraf n oil
                                                                                                                                                                                         Abs                  Paraf n oil + silicate
                                                                                                                                                                                         0.6
                                                                                                                                                                                         0.5
                                                                                                                                                                                         0.4
                                                                                                                                                                                         0.3
                                                                                                                                                                                         0.2
                              Surface Data (Simultaneous Scan of Identical Products)
                                                                                                                                                                                         0.1
                                                                                                                                                                                         0.0
                                                                                                                                                                                          4000  3600  3200  2800  2400  2000  1800  1600  1400  1200  1000  800cm -1
                                                                                                                                                     Tiled Image of Electronic Circuit Board  Infrared Spectrum Obtained from Area on the Circuit Board Indicated with Red Box

                                                                                                                                                 Calculation Formula    Calculation Formula


                            Comparison of Shape Measurements in Two Sets of CT Data                                                                                                           Left: Distribution of Paraf n Oil (Height of Peak at 1377 cm-1)
                                                                                                                                                Peak height (1330.88 - 1377.17 - 1415.75, with baseline correction)  Peak height (867.97 - 972.12 - 1211.30, with baseline correction)  Right: Distribution of Silicate (Height of Peak at 972 cm-1)


      10                                                                                                                                                                                                                                      11
   5   6   7   8   9   10   11   12   13   14   15