
Page 26 - Shimadzu Journal vol.9 Issue2
P. 26
Biopharmaceutical
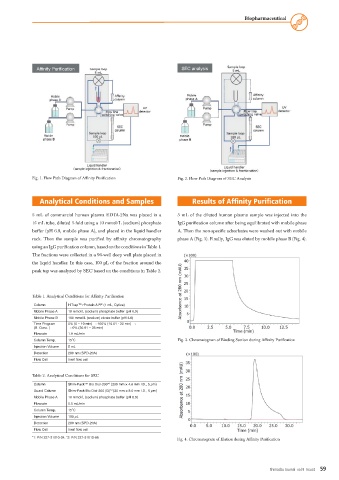
Affinity Purification SEC analysis
Fig. 1. Flow Path Diagram of Affinity Purification Fig. 2. Flow Path Diagram of SEC Analysis
Analytical Conditions and Samples Results of Affinity Purification
5 mL of commercial human plasma EDTA-2Na was placed in a 5 mL of the diluted human plasma sample was injected into the
15 mL tube, diluted 5-fold using a 10 mmol/L (sodium) phosphate IgG purification column after being equilibrated with mobile phase
buffer (pH 6.9, mobile phase A), and placed in the liquid handler A. Then the non-specific adsorbates were washed out with mobile
rack. Then the sample was purified by affinity chromatography phase A (Fig. 3). Finally, IgG was eluted by mobile phase B (Fig. 4).
using an IgG purification column, based on the conditions in Table 1.
The fractions were collected in a 96-well deep well plate placed in
the liquid handler. In this case, 100 µL of the fraction around the
peak top was analyzed by SEC based on the conditions in Table 2.
Table 1. Analytical Conditions for Affinity Purification
Column HiTrap™ rProtein A FF (1 mL, Cytiva)
Mobile Phase A 10 mmol/L (sodium) phosphate buffer (pH 6.9)
Mobile Phase B 100 mmol/L (sodium) citrate buffer (pH 4.0)
Time Program 0% (0 – 10 min) → 100% (10.01 - 20 min) →
(B. Conc. ) → 0% (20.01 – 35 min)
Flowrate 1.0 mL/min
Column Temp. 15˚C Fig. 3. Chromatogram of Binding Section during Affinity Purification
Injection Volume 5 mL
Detection 280 nm (SPD-20A)
Flow Cell Inert flow cell
Table 2. Analytical Conditions for SEC
Column Shim-Pack™ Bio Diol-300* 1 (300 mm × 4.6 mm I.D., 5 µm)
Guard Column Shim-Pack Bio Diol-300 (G)* 2 (30 mm × 8.0 mm I.D., 5 µm)
Mobile Phase A 10 mmol/L (sodium) phosphate buffer (pH 6.9)
Flowrate 0.5 mL/min
Column Temp. 15˚C
Injection Volume 100 µL
Detection 280 nm (SPD-20A)
Flow Cell Inert flow cell
*1: P/N 227-31010-04, *2: P/N 227-31010-06 Fig. 4. Chromatogram of Elution during Affinity Purification
Shimadzu Journal vol.9 Issue2 59