
Page 15 - Shimadzu SPM-9700HT
P. 15
Particle Analysis Software (option)
The particle analysis software extracts multiple particles from SPM-9700 image data and calculates
feature values for each particle, then analyzes and displays them. This is especially useful for
processing data statistically. The following wide selection of feature values and their corresponding
statistical quantities can be calculated, tabulated, sorted, or graphed. Numerical data can be exported.
Feature Parameters Statistical Values
1 Center X 16 Average Z 1 Average
2 Center Y 17 Average Round Z 2 Standard Deviation
3 Maximum Diameter 18 Area excluding Holes 3 Line Average
4 Pattern Width 19 Area including Holes 4 Square Average
5 Horizontal Feret Length 20 Surface Area 5 Cubic Average
6 Vertical Feret Length 21 Volume 6 Sum
7 Radius as Circle excluding Hole 22 Pattern Direction 7 Maximum
8 Radius as Circle including Hole 23 2nd Moment Direction 8 Minimum
9 Mean Radius 24 Area / Feret Area 9 Maximum Label
10 Mean Radius Variance 25 Particle Area / All Area 10 Minimum Label
11 Nearest Distance 26 Distortion 11 Range
12 Perimeter 27 Circular Degree 12 Samples
13 C Perimeter 28 Roughness
14 Maximum Z 29 Thin Degree
15 Minimum Z
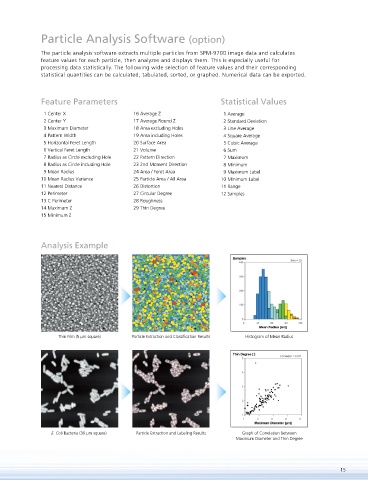
Analysis Example
Thin Film (5 m square) Particle Extraction and Classification Results Histogram of Mean Radius
E. Coli Bacteria (30 m square) Particle Extraction and Labeling Results Graph of Correlation Between
Maximum Diameter and Thin Degree
15