
Page 20 - Shimadzu SPM-9700HT
P. 20
Speci cations
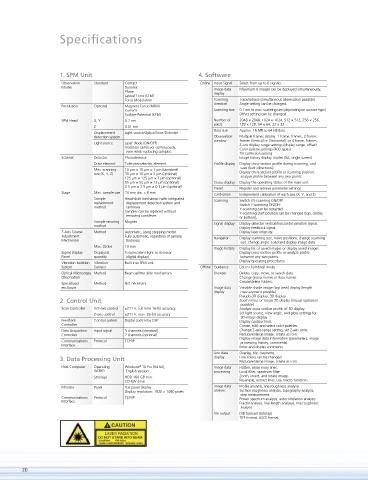
1. SPM Unit 4. Software
Observation Standard Contact Online Input Signal Select from up to 6 signals.
Modes Dynamic Image data Maximum 8 images can be displayed simultaneously.
Phase display
Lateral Force (LFM)
Force Modulation Scanning Trace/retrace (simultaneous observation possible)
direction Angle setting can be changed.
Resolution Optional Magnetic Force (MFM)
Current Scanning size 0.1 nm to max. scanning size (depending on scanner type)
Surface Potential (KFM) Offset setting can be changed.
SPM Head X, Y 0.2 nm Number of 2048 × 2048, 1024 × 1024, 512 × 512, 256 × 256,
pixels 128 × 128, 64 × 64, 32 × 32
Z 0.01 nm
Data size Approx. 16 MB to 64 kB/data
Displacement Light source/Optical lever/Detector
detection system Observation Multiple frames display: 1 frame, frames, 2 frame,
window frames (Vertical or Horizontal), or 4 frame, frames
Light source Laser diode (ON/OFF) Z-axis display range settings (display range, offset)
Irradiates cantilever continuously, Color palette settings (400 types)
even while replacing samples. Tilt correction setting
Scanner Detector Photodetector Image history display modes (list, single screen)
Drive element Tube piezoelectric element Pro le display Display cross-section pro le during scanning, and
save (both directions).
Max. scanning 10 m × 10 m × 1 m (standard)
size (X, Y, Z) 30 m × 30 m × 5 m (optional) Display cross-section pro le at scanning position,
125 m × 125 m × 7 m (optional) analyze pro le between any two points.
55 m × 55 m × 13 m (optional) Status display Display the operating status of the main unit.
2.5 m × 2.5 m × 0.3 m (optional) Preset Register and retrieve parameter settings.
Stage Max. sample size 24 mm dia. × 8 mm Calibration Independent calibration of each axis (X, Y, and Z)
Sample Head-slide mechanism with integrated Scanning
replacement displacement detection system and Switch XY-scanning ON/OFF
method cantilever Switch Y-scanning ON/OFF
Y-scanning can be restarted.
Samples can be replaced without Y-scanning start position can be changed (top, center,
removing cantilever. or bottom).
Sample securing Magnet Signal display
method Display detector vertical/horizontal variation signal.
Display feedback signal.
Z-Axis Coarse Method Automatic, using stepping motor Display laser intensity.
Adjustment Fully automatic, regardless of sample Navigator
Mechanism thickness Display scanning size, move positions, change scanning
size, change angle. Load and display image data.
Max. stroke 10 mm Image history Display list of saved images or display saved images.
Signal Display Displayed Total incident light to detector Display cross-section pro le or analyze pro le
Panel quantity (digital display) between any two points.
Vibration Isolation Vibration Built into SPM unit Display operating procedures.
System Damper Of ine Guidance List in thumbnail mode
Optical Microscope Method Beam-splitter slide mechanism Browser Delete, copy, move, or search data.
Observation Change group names or data names.
Specialized Method Not necessary. Create/delete folders.
enclosure Image data Variable shade image (top view) display (length
display measurement possible)
Pseudo-3D display, 3D display
2. Control Unit Zoom in/out or rotate 3D display (mouse operation
possible)
Scan Controller X/Y-axis control ±211 V, full time 16-bit accuracy Analyze cross-section pro le of 3D display.
Z-axis control ±211 V, max. 26-bit accuracy Set light source, view angle, and gloss settings for
Feedback Control system Digital control by DSP 3D-image display.
Display contour lines.
Controller Create, edit, and select color palettes.
Data Acquisition Input signal 5 channels (standard) Change Z-axis range setting, set Z-axis units.
Controller 7 channels (optional) Reduce/enlarge image, create as icon.
Communications Protocol TCP/IP Display image data information (parameters, image
processing history, comments).
Interface Enter and display comments.
Line data Overlay, tile, overwrite.
3. Data Processing Unit display Line colors can be changed.
Reduce/enlarge image, create as icon.
Host Computer Operating Windows ® 10 Pro (64 bit), Image data Flatten, erase noisy lines.
system English version processing Local lter, spectrum lter
Strorage HDD 160 GB min. Zoom, invert, and rotate image.
CD-RW drive Resample, extract lines, use macro functions.
Monitor Panel Flat panel display Image data Pro le analysis, line roughness analysis.
Display resolution: 1920 × 1080 pixels analysis Surface roughness analysis, topography analysis,
Communications Protocol TCP/IP step measurement.
Power spectrum analysis, autocorrelation analysis
Interface
Fractal analysis, line length analysys, line roughness
analysis
File output DIB formant (bitmap)
TIFF format, ASCII format
20