
Page 13 - Shimadzu SPM-9700HT
P. 13
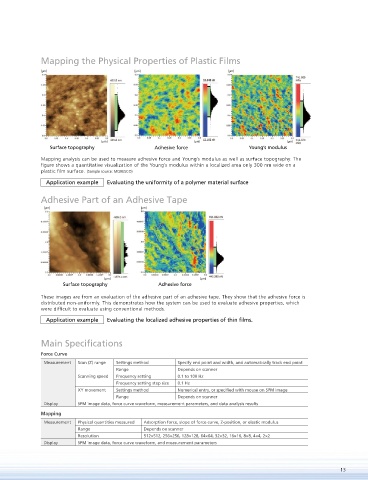
Mapping the Physical Properties of Plastic Films
               [µm]                           [µm]                           [µm]


                                   [µm]                          [µm]                           [µm]
                  Surface topography                Adhesive force                 Young’s modulus
               Mapping analysis can be used to measure adhesive force and Young’s modulus as well as surface topography. The
                gure shows a quantitative visualization of the Young’s modulus within a localized area only 300 nm wide on a
               plastic  lm surface. (Sample source: MORESCO)
                Application example  Evaluating the uniformity of a polymer material surface

               Adhesive Part of an Adhesive Tape

                [µm]                            [µm]


                                    [µm]                           [µm]
                      Surface topography             Adhesive force

               These images are from an evaluation of the adhesive part of an adhesive tape. They show that the adhesive force is
               distributed non-uniformly. This demonstrates how the system can be used to evaluate adhesive properties, which
               were dif cult to evaluate using conventional methods.

                Application example  Evaluating the localized adhesive properties of thin  lms.


               Main Specifications
               Force Curve
                Measurement  Scan (Z) range  Settings method  Specify end point and width, and automatically track end point
                                        Range               Depends on scanner
                           Scanning speed  Frequency setting  0.1 to 100 Hz
                                        Frequency setting step size  0.1 Hz
                           XY movement  Settings method     Numerical entry, or speci ed with mouse on SPM image
                                        Range               Depends on scanner
                Display    SPM image data, force curve waveform, measurement parameters, and data analysis results
               Mapping
                Measurement  Physical quantities measured  Adsorption force, slope of force curve, Z-position, or elastic modulus
                           Range                 Depends on scanner
                           Resolution            512×512, 256×256, 128×128, 64×64, 32×32, 16×16, 8×8, 4×4, 2×2
                Display    SPM image data, force curve waveform, and measurement parameters


                                                                                                                  13