
Page 72 - Application Notebook - Solution for Food Safety
P. 72
LAAN-A-LC-E289
Application High Performance Liquid Chromatography
News Analysis of Nitrous Acid and Ammonium
Thiocyanate in Fertilizers
No.L513
After it is spread onto agricultural land, nitrogen Q Linearity of Calibration Curves
fertilizer converts to nitrate-nitrogen or nitrite-nitrogen Fig. 2 shows calibration curves for nitrous acid and
and leaches into subsoil and river water polluting the ammonium thiocyanate analyzed under the conditions
groundwater. Drinking water with a high nitrate- shown in Table 1. The range used for calibration curves
nitrogen or nitrite-nitrogen content is a potential public was 1 to 20 mg/L. Good linearity was obtained for both
health risk. It causes methemoglobinemia that inhibits compounds with contribution rates (R ) of 0.9999 or
2
the oxygen-carrying capacity of blood and has caused higher.
deaths in infants outside Japan.
Fertilizers with high concentrations of nitrous acid and
ammonium thiocyanate have a negative effect on plant ᶗ) Nitrous acid ᶘ) Ammonium thiocyanate
growth, therefore maximum content levels (permitted (1 - 20 mg/L) (1 - 20 mg/L)
2
R = 0.99999
2
R = 0.99992
content levels) for toxic substances are prescribed in Area (×1,000,000) Area (×100,000)
official specifications for commercial fertilizers
1)
according to the Fertilizer Control Law . 1.25 5.0
An example of simultaneous analysis of the nitrous acid
and ammonium thiocyanate content of fertilizer by 1.00 4.0
HPLC is described. Analysis was performed in 0.75 3.0
conformance with the test method that appears in
2)
Testing Methods for Fertilizers (5.8.b and 5.9.a, 2016) , 0.50 2.0
published by the Food and Agricultural Materials
Inspection Center (FAMIC). 0.25 1.0
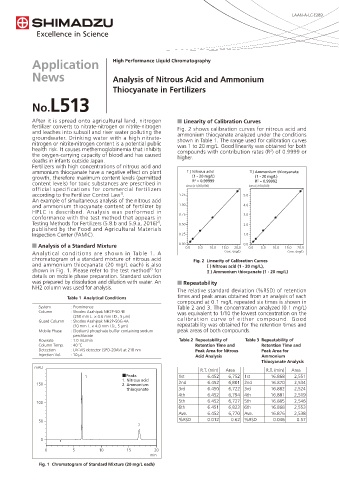
Q Analysis of a Standard Mixture 0.00 0.0 5.0 10.0 15.0 20.0 0.0 0.0 5.0 10.0 15.0 20.0
Analytical conditions are shown in Table 1. A Conc. (mg/L) Conc. (mg/L)
chromatogram of a standard mixture of nitrous acid Fig. 2 Linearity of Calibration Curves
and ammonium thiocyanate (20 mg/L each) is also ᶗ) Nitrous acid (1 - 20 mg/L),
2)
shown in Fig. 1. Please refer to the test method for ᶘ) Ammonium thiocyanate (1 - 20 mg/L)
details on mobile phase preparation. Standard solution
was prepared by dissolution and dilution with water. An Q Repeatability
NH2 column was used for analysis.
The relative standard deviation (%RSD) of retention
Table 1 Analytical Conditions times and peak areas obtained from an analysis of each
compound at 0.1 mg/L repeated six times is shown in
System : Prominence Table 2 and 3. The concentration analyzed (0.1 mg/L)
Column : Shodex Asahipak NH2P-50 4E was equivalent to 1/10 the lowest concentration on the
(250 mm L. × 4.6 mm I.D., 5 μm)
Guard Column : Shodex Asahipak NH2P-50G 4A calibration curve of either compound. Good
(10 mm L. × 4.0 mm I.D., 5 μm) repeatability was obtained for the retention times and
Mobile Phase : (Sodium) phosphate buffer containing sodium peak areas of both compounds.
perchlorate
Flowrate : 1.0 mL/min Table 2 Repeatability of Table 3 Repeatability of
Column Temp. : 40 ˚C Retention Time and Retention Time and
Detection : UV-VIS detector (SPD-20AV) at 210 nm Peak Area for Nitrous Peak Area for
Injection Vol. : 10 μL Acid Analysis Ammonium
Thiocyanate Analysis
mAU
R.T. (min) Area R.T. (min) Area
1 ˙Peaks 1st 6.452 6,752 1st 16.868 2,551
1. Nitrous acid
150 2. Ammonium 2nd 6.452 6,801 2nd 16.870 2,534
thiocyanate 3rd 6.450 6,722 3rd 16.882 2,524
4th 6.452 6,794 4th 16.881 2,519
100 5th 6.452 6,727 5th 16.885 2,546
6th 6.451 6,823 6th 16.868 2,553
Ave. 6.452 6,770 Ave. 16.876 2,538
50 %RSD 0.012 0.62 %RSD 0.046 0.57
2
0
0 5 10 15 20
min
Fig. 1 Chromatogram of Standard Mixture (20 mg/L each)