
Page 37 - Application Notebook - PFAS Analysis
P. 37
No. SSI-LCMS-106
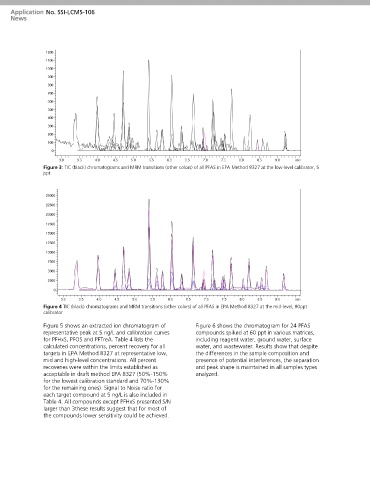
Figure 3: TIC (black) chromatograms and MRM transitions (other colors) of all PFAS in EPA Method 8327 at the low-level calibrator, 5
ppt
Figure 4 TIC (black) chromatograms and MRM transitions (other colors) of all PFAS in EPA Method 8327 at the mid-level, 80ppt
calibrator
Figure 5 shows an extracted ion chromatogram of Figure 6 shows the chromatogram for 24 PFAS
representative peak at 5 ng/L and calibration curves compounds spiked at 60 ppt in various matrices,
for PFHxS, PFOS and PFTreA. Table 4 lists the including reagent water, ground water, surface
calculated concentrations, percent recovery for all water, and wastewater. Results show that despite
targets in EPA Method 8327 at representative low, the differences in the sample composition and
mid and high-level concentrations. All percent presence of potential interferences, the separation
recoveries were within the limits established as and peak shape is maintained in all samples types
acceptable in draft method EPA 8327 (50%-150% analyzed.
for the lowest calibration standard and 70%-130%
for the remaining ones). Signal to Noise ratio for
each target compound at 5 ng/L is also included in
Table 4. All compounds except PFHxS presented S/N
larger than 3these results suggest that for most of
the compounds lower sensitivity could be achieved.