
Page 36 - Application Notebook - PFAS Analysis
P. 36
No. SSI-LCMS-106
■ Results and Discussion
It is known that PFAS can be present in reagents, Calibration was performed for all PFAS targets using
glassware, pipettes, tubing, degassers and other a nine-point calibration curve, ranging from 5 ng/L -
parts from the LC-MS/MS instruments. PFAS 200 ng/L. The linearity of the curve was determined
contamination coming from the LC system is using a 1/x weighting factor and not forcing through
eliminated using a delay column placed between the zero. Excellent linearity was obtained with correlation
2
reagents and the sample valve. This separates PFAS coefficients (r ) greater than 0.99 for all analytes or
in the sample from the PFAS in the LC system. All transitions. Calibration residuals of each standards
supplies used to conduct the study were free from were within ±30%. Figure 3 shows a total ion
PFAS contamination. To monitor the lack of chromatogram and MRMs from a 5 ng/L standard;
contamination two blanks were injected at the this figure demonstrates the separation and peak
beginning of each batch: system null injection (air shape of targets at the lowest concentration
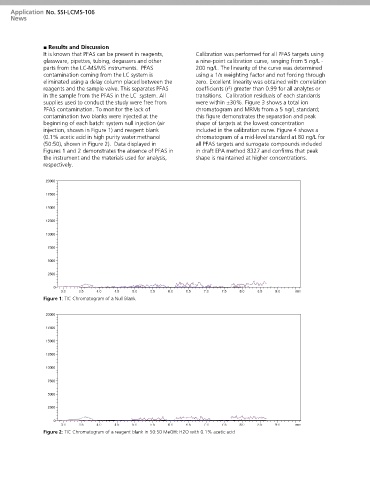
injection, shown in Figure 1) and reagent blank included in the calibration curve. Figure 4 shows a
(0.1% acetic acid in high purity water:methanol chromatogram of a mid-level standard at 80 ng/L for
(50:50), shown in Figure 2). Data displayed in all PFAS targets and surrogate compounds included
Figures 1 and 2 demonstrates the absence of PFAS in in draft EPA method 8327 and confirms that peak
the instrument and the materials used for analysis, shape is maintained at higher concentrations.
respectively.
Figure 1: TIC Chromatogram of a Null Blank
Figure 2: TIC Chromatogram of a reagent blank in 50:50 MeOH: H2O with 0.1% acetic acid