
Page 22 - Solutions for Plastic Evaluation
P. 22
n
Product Evaluation
Optical Properties
UV
Evaluation of Plastic Materials Measurement of Diffuse Reflectance in Plastic Using an Integrating Sphere
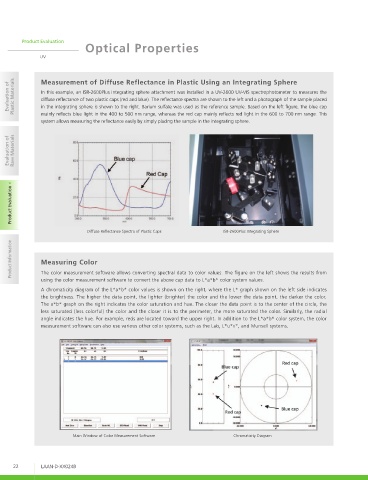
In this example, an ISR-2600Plus integrating sphere attachment was installed in a UV-2600 UV-VIS spectrophotometer to measures the
diffuse reflectance of two plastic caps (red and blue). The reflectance spectra are shown to the left and a photograph of the sample placed
in the integrating sphere is shown to the right. Barium sulfate was used as the reference sample. Based on the left figure, the blue cap
mainly reflects blue light in the 400 to 500 nm range, whereas the red cap mainly reflects red light in the 600 to 700 nm range. This
system allows measuring the reflectance easily by simply placing the sample in the integrating sphere.
Evaluation of Raw Materials
Product Evaluation
Diffuse Reflectance Spectra of Plastic Caps ISR-2600Plus Integrating Sphere
Product Information Measuring Color
The color measurement software allows converting spectral data to color values. The figure on the left shows the results from
using the color measurement software to convert the above cap data to L*a*b* color system values.
A chromaticity diagram of the L*a*b* color values is shown on the right, where the L* graph shown on the left side indicates
the brightness. The higher the data point, the lighter (brighter) the color and the lower the data point, the darker the color.
The a*b* graph on the right indicates the color saturation and hue. The closer the data point is to the center of the circle, the
less saturated (less colorful) the color and the closer it is to the perimeter, the more saturated the color. Similarly, the radial
angle indicates the hue. For example, reds are located toward the upper right. In addition to the L*a*b* color system, the color
measurement software can also use various other color systems, such as the Lab, L*u*v*, and Munsell systems.
Main Window of Color Measurement Software Chromaticity Diagram
22 LAAN-D-XX024B