
Page 21 - Solutions for Plastic Evaluation
P. 21
n
Local Structure Product Evaluation
Infrared Microscope Systems (FTIR)
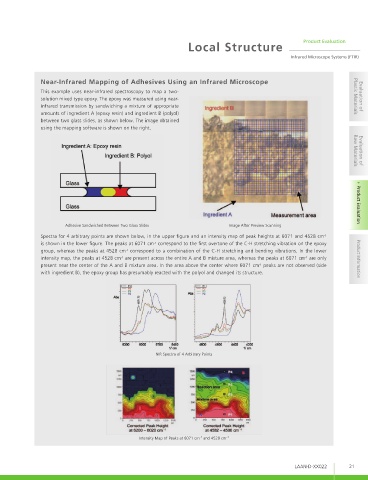
Near-Infrared Mapping of Adhesives Using an Infrared Microscope
This example uses near-infrared spectroscopy to map a two-
solution mixed type epoxy. The epoxy was measured using near- Plastic Materials Evaluation of
infrared transmission by sandwiching a mixture of appropriate
amounts of ingredient A (epoxy resin) and ingredient B (polyol)
between two glass slides, as shown below. The image obtained
using the mapping software is shown on the right. Raw Materials Evaluation of
Adhesive Sandwiched Between Two Glass Slides Image After Preview Scanning Product Evaluation
Spectra for 4 arbitrary points are shown below, in the upper figure and an intensity map of peak heights at 6071 and 4528 cm -1
is shown in the lower figure. The peaks at 6071 cm correspond to the first overtone of the C-H stretching vibration on the epoxy
-1
group, whereas the peaks at 4528 cm correspond to a combination of the C-H stretching and bending vibrations. In the lower
-1
intensity map, the peaks at 4528 cm are present across the entire A and B mixture area, whereas the peaks at 6071 cm are only Product Information
-1
-1
present near the center of the A and B mixture area. In the area above the center where 6071 cm peaks are not observed (side
-1
with ingredient B), the epoxy group has presumably reacted with the polyol and changed its structure.
NIR Spectra of 4 Arbitrary Points
-1
Intensity Map of Peaks at 6071 cm and 4528 cm -1
LAAN-D-XX022 21