
Page 29 - Oligonucleotide Therapeutics Solution Guide
P. 29
Characteristic analysis
Quality Control
Quantitation & Spectrum Confirmation BioSpec-nano
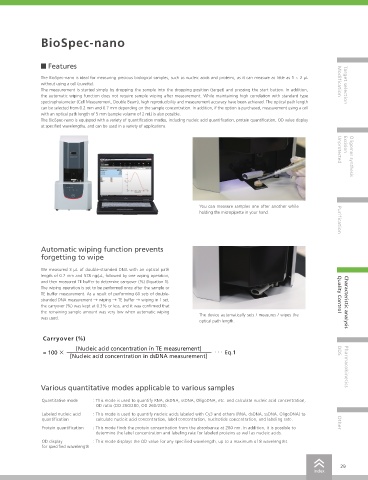
Features
Quantitation of Nucleic Acid Using
The BioSpec-nano is ideal for measuring precious biological samples, such as nucleic acids and proteins, as it can measure as little as 1 ~ 2 μL Modification
BioSpec-nano without using a cell (cuvette). Target selection
The measurement is started simply by dropping the sample into the dropping position (target) and pressing the start button. In addition,
click here the automatic wiping function does not require sample wiping after measurement. While maintaining high correlation with standard type
spectrophotometer (Cell Measurement, Double Beam), high reproducibility and measurement accuracy have been achieved. The optical path length
can be selected from 0.2 mm and 0.7 mm depending on the sample concentration. In addition, if the option is purchased, measurement using a cell
• It can be used to measure the concentration of extracted double-stranded with an optical path length of 5 mm (sample volume of 2 mL) is also possible.
DNA and to check the degree of purification. The BioSpec-nano is equipped with a variety of quantification modes, including nucleic acid quantification, protein quantification, OD value display
at specified wavelengths, and can be used in a variety of applications.
benefits • It is possible to measure from a minimum sample capacity of 1 µL.
• It is equipped with an automatic wiping function that achieves low carryover. Unprotected Excision
Methods and Results Oligomer synthesis
Sample Double-stranded DNA
Conc., Volume As shown in Table 1
Preparation Samples were prepared using Tris-EDTA (TE) buffers at the
concentrations shown in Table 1.
Analytical Samples were measured to 10 times of optical density (OD) at
Conditions 260 nm at each optical path length (Table 1).
The result of The correlation coefficient between the measured value and the You can measure samples one after another while
optical path reference value was 0.999 (Figure 1). When the concentration holding the micropipette in your hand.
length 0.2 mm was 250 ng/μL or more, the reproducibility of measurements was
1.4% or less for CV values (%) and -5.4% to 2.8% for OD errors Purification
(%).
The result of The correlation coefficient between the measured value and the
optical path reference value was 0.999 (Figure 2). When the concentration Figure 1 The result of optical path length 0.2 mm
length 0.7 mm was 70 ng/μL or more, the reproducibility of measurements was
1.4% or less for CV values (%) and -8.6% to 4.4% for OD errors
(%). Automatic wiping function prevents
The result of a The correlation coefficient between the measured value and the
5 mm optical reference value was 0.999 (Fig. 3). When the concentration was forgetting to wipe
path length cell 70 ng/μL or more, the reproducibility of measurements was 0.6%
or less for CV values (%) and -1.6% to 3.6% for OD errors (%). We measured 3 μL of double-stranded DNA with an optical path
length of 0.7 mm and 578 ng/μL, followed by one wiping operation,
Table 1 Analysis Conditions
and then measured TE buffer to determine carryover (%) (Equation 1).
Concentration 50 ~ 3700 ng/µL The wiping operation is set to be performed once after the sample or
Opticall path length 0.2 mm
Volume 1 µL TE buffer measurement. As a result of performing 60 sets of double- Quality Control
Concentration 15 ~ 1000 ng/µL stranded DNA measurement → wiping → TE buffer → wiping in 1 set,
Opticall path length 0.7 mm Characteristic analysis
Volume 2 µL the carryover (%) was kept at 0.3% or less, and it was confirmed that
Concentration 2 ~ 150 ng/µL the remaining sample amount was very low when automatic wiping
5 mm pathlength cell (Option) Figure 2 The result of optical path length 0.7 mm The device automatically sets / measures / wipes the
Volume 2 mL was used.
optical path length.
Carryover (%)
[Nucleic acid concentration in TE measurement]
= 100 × · · · Eq.1 DDS
[Nucleic acid concentration in dsDNA measurement] Pharmacokinetics
Various quantitative modes applicable to various samples
Figure 3 The result of a 5 mm optical path length cell
Quantitative mode : This mode is used to quantify RNA, dsDNA, ssDNA, OligoDNA, etc. and calculate nucleic acid concentration,
OD ratio (OD 260/280, OD 260/230).
Labeled nucleic acid : This mode is used to quantify nucleic acids labeled with Cy3 and others (RNA, dsDNA, ssDNA, OligoDNA) to
quantification calculate nucleic acid concentration, label concentration, nucleotide concentration, and labeling rate.
Conclusions Other
Protein quantification : This mode finds the protein concentration from the absorbance at 280 nm. In addition, it is possible to
determine the label concentration and labeling rate for labeled proteins as well as nucleic acids.
Bipspec-nano enables nucleic acid quantification with excellent photometric linearity, reproducibility, and accuracy at optical path lengths of 0.2 mm
and 0.7 mm with sample volumes of 1 ~ 2 μL, respectively. OD display : This mode displays the OD value for any specified wavelength, up to a maximum of 8 wavelengths.
for specified wavelength
28 29
index index