
Page 25 - Oligonucleotide Therapeutics Solution Guide
P. 25
Characteristic analysis
Quality Control
Molecular Weight Confirmation & Quantitation LCMS-8060
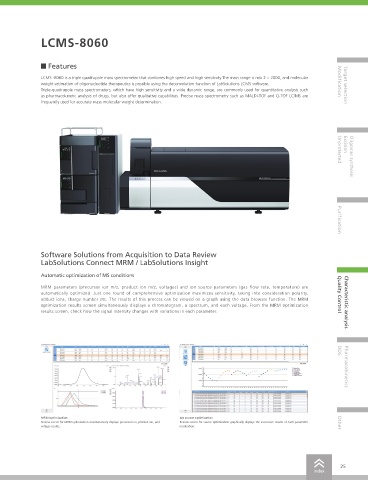
Features
Quantitative Analysis and Determination of
LCMS -8060 is a triple quadrupole mass spectrometer that combines high speed and high sensitivity.The mass range is m/z 2 ~ 2000, and molecular Modification
Molecular Weight by Triple Quadrupole Mass Spectrometry weight estimation of oligonucleotide therapeutics is possible using the deconvolution function of LabSolutions LCMS software. Target selection
Triple-quadrupole mass spectrometers, which have high sensitivity and a wide dynamic range, are commonly used for quantitative analysis such
click here as pharmacokinetic analysis of drugs, but also offer qualitative capabilities. Precise mass spectrometry such as MALDI-TOF and Q-TOF LC/MS are
frequently used for accurate mass molecular weight determination.
• High sensitivity quantitation and molecular weight confirmation are possible
with one system.
benefits • Ease of maintenance helps minimize analytical downtime. Unprotected Excision
Methods and Results Oligomer synthesis
Sample 5‘-pU CGAAGUAUUCCGCGUACG dTdT-3‘
Mw: 6646.0 (average mass)
5‘-pC GUACGCGGAAUACUUCGA dTdT-3‘
Mw: 6669.0 (average mass)
Conc., Volume 1 ~ 10000 fmol/L, 10 µL
Preparation Dilution in ultrapure water to the concentrations above.
Analytical As shown in Table 1
Conditions Purification
Results Calibration curves for AS-Oligo and SS-Oligo were obtained
from 1 fmol to 10,000 fmol. SIM chromatograms for the injection
volumes of 1 fmol (limit of detection, LOD) and 5 fmol (limit of
quantitation, LOQ). Figure 1 shows the calibration curves. The Figure 1 Calculation Curves Obtained from SIM Chromatograms
2
coefficient of determination (R ) was
0.997 for AS-Oligo and 0.995 for SS-Oligo. Figure 2 shows the
SIM chromatogram of a mixed solution of SSOligo and AS-Oligo
(100 fmol each). Using ion pair Software Solutions from Acquisition to Data Review
chromatography, retention times were 6.88 min and 6.94 min, LabSolutions Connect MRM / LabSolutions Insight
respectively, and resolution R was 0.3.
Figures 3 and 4 show the mass spectra of the two components.
Ions with valences of 4 to 9 were detected in both SS-Oligo and Automatic optimization of MS conditions
AS-Oligo.
Deconvolution results estimated the molecular weights of AS-
Oligo and SS-Oligo at 6,645.6 and 6,667.1, respectively, with FIgure 2 SIM Chromatogram MRM parameters (precursor ion m/z, product ion m/z, voltages) and ion source parameters (gas flow rate, temperature) are
corresponding errors from the average molecular weights at 0.4 automatically optimized. Just one round of comprehensive optimization maximizes sensitivity, taking into consideration polarity,
Da and 1.9 Da. Quality Control
adduct ions, charge number etc. The results of this process can be viewed on a graph using the data browser function. The MRM Characteristic analysis
optimization results screen simultaneously displays a chromatogram, a spectrum, and each voltage. From the MRM optimization
Table1 Analysis Conditions
[HPLC conditions] (Nexera) results screen, check how the signal intensity changes with variations in each parameter.
Column: Commercially available C18colmn
(100 mm × 2.1 mmI.D., 1.7 µm)
Mobile phases: A) 200 mM HFIP*1 and 7.5 mM TEA*2/water
B) Methanol
Grandient Program: B conc. 4%(0 min) – 20%(8.0 min)
Flow rate: 0.2 mL/min
Column Temp.: 75 °C
Injection volume: 10 µL DDS
Figure 3 Mass Spectra of AS-Oligo
[MS conditions] (LCMS-8060)
Ionization: ESI(Negative mode)
Probe Voltage: -3 kV Pharmacokinetics
Mode: Q3scan(m/z500-1800)
SIM m/z 1666.0(SS), m/z1659.9(AS)
Nebulizing gas flow: 3.0 L/min
Drying gas flow: 5.0 L/min
Heating gas fow: 15.0 L/min
DL Temp.: 250 °C
Heat Block Temp.: 500 °C
Interface Temp.: 350 °C
*1 1,1,1,3,3,3-Hexafluoro-2-propanol
*2 Triethylamine
MRM optimization Ion source optimization
Review screen for source optimization graphically displays the successive results of each parameter
Review screen for MRM optimization simultaneously displays precursor ion, product ion, and
Conclusions Figure 4 Mass Spectra of SS-Oligo voltage results.. modication. Other
Together with accurate quantitative analysis of an siRNA type oligonucleotide using the LCMS-8060 and SIM, molecular weight determination can
be made with an error of just a few Da using deconvolution calculation capabilities.
24 25
index index