Page 20 - Oligonucleotide Therapeutics Solution Guide
P. 20

Characteristic analysis
                  Quality Control

                     Molecular Weight Confirmation & Quantitation                                                                       LCMS-9030


                                                                                                                                           Features
                                  Molecular Weight Determination and Quantitation of Oligonucleotide
                                                                                                                                        LCMS-9030 is a quadrupole time-of-flight (Q-TOF) mass spectrometer with two types of ion mass separation mechanisms: quadrupole and time-of-  Modification
                               Therapeutics Using Quadrupole Time-of- Flight Mass Spectrometer LCMS-9030                                flight. Unique technologies abound, such as technology to improve ion utilization efficiency, processing technology to produce high-strength fine   Target selection
                                                                                                                                        grid electrodes, high-precision temperature control, and optimization of potential distribution, enabling data acquisition with both high sensitivity
                                                                                                 click here                             and high resolution while maintaining stable mass accuracy.
                                                                                                                                        Since oligonucleotide therapeutics have a molecular weight of 6000 or more at 20 bases, high-precision mass spectrometers such as Q-TOF mass
                                                                                                                                        spectrometers are used to confirm the molecular weight.
                                        •    High-resolution mass spectra provide more accurate molecular weight
                                          confirmation.
                           benefits     •    Achieves stable mass accuracy without frequent mass calibration.                                                                                                                                Excision


                        Methods and Results                                                                                                                                                                                                Unprotected  Oligomer synthesis

                     Sample   5'-mG-mC*-mC*-mU*-mC*-dA-dG-dT-dC*-dT-dG-dC*-dT-
                              dT-dC*-mG-mC*-mA-mC*-mC*-3‘
                              m: 2‘-O-(2-Methoxyethyl) nucleoside (2-MOE)
                              * : 5-methylated derivatives of C and U
                              D : 2’-deoxyribonucleoside
                              Monoisotopic mass: 6431.7239
                     Conc., Volume 1 ~ 1000 ng/mL, 5 µL
                     Preparation  Dilution in ultrapure water to the concentrations above.
                     Analytical   The HPLC and MS analysis conditions are shown in
                     Conditions  Table 1. In this analysis, HFIP (1,1,1,3,3,3-Hexafluoro-2-propanol)                                                                                                                                       Purification
                              and DIPEA (N, N-diisopropylethylamine) were used in the mobile
                              phase to allow highly sensitive measurement to be performed.
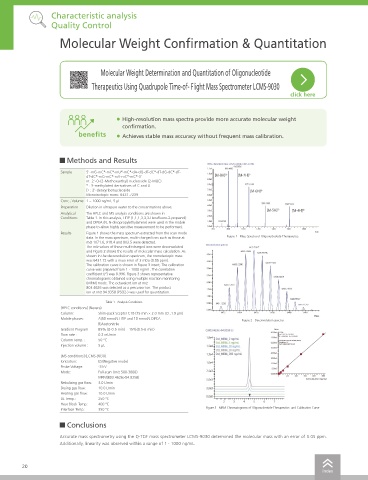
                     Results  Figure 1 shows the mass spectrum extracted from the scan mode
                              data. In the mass spectrum, multi-charged ions such as those at   Figure 1   Mass Spectra of Oligonucleotide Therapeutics
                              m/z 1071.6, 918.4 and 803.5 were detected.
                              The m/z values of these multi-charged ions were deconvoluted
                              and Figure 2 shows the results of molecular mass calculation. As
                              shown in the deconvolution spectrum, the monoisotopic mass
                              was 6431.72 with a mass error of 3 mDa (0.05 ppm).
                              The calibration curve is shown in Figure 3 insert, The calibration
                              curve was prepared from 1 - 1000 ng/mL. The correlation
                                    2
                              coefficient (r ) was 0.996. Figure 3 shows representative
                              chromatograms obtained using multiple reaction monitoring
                              (MRM) mode. The octavalent ion at m/z
                              803.4626 was selected as a precursor ion. The product
                              ion at m/z 94.9358 (PSO2-) was used for quantitation.                                                     Simple Ionization Unit                                                                             Quality Control
                                    Table 1   Analysis Conditions                                                                       In addition to the standard ESI ionization unit,                                                     Characteristic analysis
                     [HPLC conditions] (Nexera)                                                                                         optional APCI and Dual Ion Source (DUIS) probes
                     Column:      Shim-pack Scepter C18 (75 mm × 2.0 mm I.D.,1.9 µm)                                                    are available for the LCMS-9030 to meet various
                     Mobile phases:  A)50 mmol/L HFIP and 10 mmol/L DIPEA        Figure 2   Deconvolution spectra                       analytical needs. Shimadzu's DUIS offers an
                                  B)Acetonitrile
                     Gradient Program  B5% (0-0.5 min) – 15%(0.5-6 min)                                                                 efficient combination of ESI and APCI ionization
                     Flow rate :  0.2 mL/min                                                                                            capabilities.
                     Column Temp. :  50 °C
                     Injection volume :  5 µL
                     [MS conditions] (LCMS-9030)                                                                                                                                                                                           DDS
                     Ionization:  ESI(Negative mode)
                     Probe Voltage:  -3 kV                                                                                              Calibrant Delivery                                                                                   Pharmacokinetics
                     Mode:        Full-scan (m/z 500-3000)
                                  MRM(803.4626>94.9358)                                                                                 System (CDS)
                     Nebulizing gas flow:  3.0 L/min
                     Drying gas flow:  10.0 L/min                                                                                       The CDS allows calibration standards to be introduced via a separate ionization probe that
                     Heating gas flow:  10.0 L/min                                                                                      functions independently from the main probe. This optional sub-ionization unit is installed in the
                     DL Temp.:    250 °C                                                                                                main probe housing and is available for all probe types (ESI/APCI/DUIS). By having two probes
                     Heat Block Temp.:  400 °C
                     Interface Temp.:  350 °C                        Figure 3   MRM Chromatograms of Oligonucleotide Therapeutics  and Calibration Curve  in one system, high-concentration calibration standards can be introduced only when needed
                                                                                                                                        without switching flow lines, and are kept in isolation from the sample stream, eliminating
                                                                                                                                        contamination.
                        Conclusions                                                                                                                                                                                                        Other

                     Accurate mass spectrometry using the Q-TOF mass spectrometer LCMS-9030 determined the molecular mass with an error of 0.05 ppm.
                     Additionally, linearity was observed within a range of 1 - 1000 ng/mL.


        20                                                                                                                                                                                                                                  21
                                                                                                            index                                                                                                                  index
   15   16   17   18   19   20   21   22   23   24   25