
Page 67 - LC-SFC_Pharma_Brochure
P. 67
2-2. Simultaneous Quantitation of Main Area (×10 ) 6
Component and Minor Impurities 30 Correlation factor
R=0.9996726
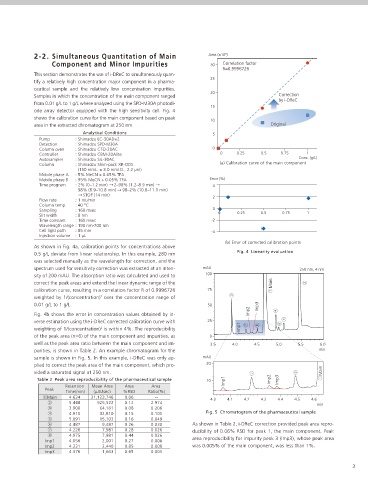
This section demonstrates the use of i-DReC to simultaneously quan-
25
tify a relatively high concentration major component in a pharma-
ceutical sample and the relatively low concentration impurities.
20
Samples in which the concentration of the main component ranged Correction
by i-DReC
from 0.01 g/L to 1 g/L where analyzed using the SPD-M30A photodi-
15
ode array detector equipped with the high sensitivity cell. Fig. 4
shows the calibration curve for the main component based on peak
10
area in the extracted chromatogram at 250 nm. Original
Analytical Conditions 5
Pump : Shimadzu LC-30AD×2
Detection : Shimadzu SPD-M30A
Column oven : Shimadzu CTO-20AC 0
Controller : Shimadzu CBM-20Alite 0 0.25 0.5 0.75 1
Autosampler : Shimadzu SIL-30AC Conc. (g/L)
Column : Shimadzu Shim-pack XR-ODS (a) Calibration curve of the main component
(150 mmL. × 3.0 mmI.D., 2.2 µm)
Mobile phase A : 5% MeCN + 0.05% TFA
Mobile phase B : 95% MeCN + 0.05% TFA Error (%)
Time program : 2% (0–1.2 min) 2–98% (1.2–8.9 min) 4
98% (8.9–10.8 min) 98–2% (10.8–11.1 min)
STOP (14 min) 2
Flow rate : 1 mL/min
Column temp. : 40 °C
Sampling : 160 msec 0 0 0.25 0.5 0.75 1
Slit width : 8 nm
Time constant : 160 msec -2
Wavelength range : 190 nm-700 nm
Cell light path : 85 mm -4
Injection volume : 1 µL
(b) Error of corrected calibration points
As shown in Fig. 4a, calibration points for concentrations above
Fig. 4 Linearity evaluation
0.5 g/L deviate from linear relationship. In this example, 280 nm
was selected manually as the wavelength for correction, and the
spectrum used for sensitivity correction was extracted at an inten- mAU 250 nm, 4 nm
sity of 200 mAU. The absorption ratio was calculated and used to 100
correct the peak areas and extend the linear dynamic range of the Main
calibration curve, resulting in a correlation factor R of 0.9996726 75
weighted by 1/(concentration) over the concentration range of
2
0.01 g/L to 1 g/L. 50 Imp3
Imp2
Fig. 4b shows the error in concentration values obtained by in-
verse estimation using the i-DReC corrected calibration curve with 25
weighting of 1/(concentration) is within 4%. The reproducibility Imp1
2
of the peak area (n=6) of the main component and impurities, as 0
well as the peak area ratio between the main component and im- 3.5 4.0 4.5 5.0 5.5 6.0
purities, is shown in Table 2. An example chromatogram for the min
sample is shown in Fig. 5. In this example, i-DReC was only ap- mAU
plied to correct the peak area of the main component, which pro- 20
vided a saturated signal at 250 nm. Main
Table 2 Peak area reproducibility of the pharmaceutical sample 10 Imp1 Imp2 Imp3
Retention Mean Area Area Area
Peak
Time(min) (µAUsec) %RSD Ratio(%)
4.634 31,123,746 0.06 --
4.0 4.1 4.2 4.3 4.4 4.5 4.6
5.448 925,522 0.12 2.974
min
3.900 64,161 0.08 0.206
4.910 32,810 0.15 0.105 Fig. 5 Chromatogram of the pharmaceutical sample
5.091 15,103 0.16 0.049
4.487 9,487 0.26 0.030 As shown in Table 2, i-DReC correction provided peak area repro-
4.226 7,981 0.28 0.026 ducibility of 0.06% RSD for peak 1, the main component. Peak
4.975 7,981 0.44 0.026
4.056 2,001 0.27 0.006 area reproducibility for impurity peak 3 (Imp3), whose peak area
4.331 2,440 0.85 0.008 was 0.005% of the main component, was less than 1%.
4.376 1,663 0.65 0.005
3