Page 62 - LC-SFC_Pharma_Brochure
P. 62

mV
                         mAU                                            mV                                                                        50                                       3-2.  Detailed Peak Detection Settings
                        2.0
                                                                                     Main peak  Impurity                                                                                   peak integration range, and peak-baseline type may not be enough to
                           [Detection Threshold] = 10                  4                                                                          40                                       For complex chromatograms, adjustments of the detection threshold,
                        1.5                                            3                                                                          30                                       obtain the desired peak integration results. i-PeakFinder is compatible
                                                                                                                                                  20                                       with a wide variety of chromatograms and allows the user to configure
                                                                       2
                        1.0                                                                                                                                                                more detailed peak detection conditions. Some of these detailed settings
                                                                                                                                                  10                                       are described below:
                                                                       1
                        0.5                                                                                                                       0                                        (1) To Detect Peaks Not Affected by Noise [Minimum Half Width]
                                                                       0                                                                            1.00  1.05  1.10  min                  Smoothing  is  sometimes  performed  on  chromatograms  obtained  via
                                                                                                                                                                                           LCMS. If the noise frequency is close to the peak frequency, then it be-
                        0.0                                                                                                                   Fig. 5  Chromatogram with Peak Tailing (N=5)
                                                                           12.5       15.0      17.5   min                                                                                 comes difficult to determine peaks automatically and single peaks may
                           17.5      20.0   min                                 [Baseline Type] Not conÿgured                           Table 2  Comparison of Area Reproducibility Between the Traditional  be recognized as multiple peaks. In this situation, configuring the mini-
                Normal shoulder peaks can be detected with no special parameter adjustment  mV                                                                                             mum half width setting ignores noise smaller than that value and en-
                                                                                                                                              Method and i-PeakFinder                      sures that peaks with a FWHM value above the set minimum value are
                         mAU                                           4
                        2.0                                                                                                                             i-PeakFinder    Traditional method  detected among the peaks with a wide wave profile due to smoothing.
                           [Detection Threshold] = 10                                Main peak  Impurity                                  %RSD            0.106             0.275          Fig. 8 shows the difference made by increasing the minimum FWHM
                           [Detection Threshold of                     3                                                                                                                   value. This feature is useful when noise can be observed in a peak.
                        1.5  Unseparated Small Peak] = 0.3                                                                               Processing  Peak-baseline Type: Base to Base  Width: 1 s
                                                                       2                                                                            Peak-Baseline Height* 2  Slope: 2000 uV/min
                                                                                                                                                                * Described in more detail later in the article
                        1.0                                            1
                                                                                                                                      3. Setting Parameters
                                                                                                                                      3. Setting Parameters
                                                                       0
                        0.5
                                                                                                                                      i-PeakFinder not only performs highly accurate peak integration with de-
                                                                           12.5       15.0      17.5   min                                                                                        14.00  14.50  15.00  14.00  14.50  15.00
                        0.0                                                                                                           fault settings but also includes more detailed settings for adjusting the peak
                                                                                [Baseline Type] Vertical Division                                                                             [Minimum Half Width] Not conÿgured  [Minimum Half Width] = 2
                                                                                                                                      detection conditions (peak width and peak-baseline start and end heights)
                                                                        mV
                           17.5      20.0   min                                                                                       and  peak-unifying  conditions  that  determine  how  to  combine  multiple
              Even very small shoulder peaks can be detected with additional parameter adjustments.  4                                peaks. The most important of these settings will be explained here.
                                                                                     Main peak  Impurity
                     Fig. 2  Examples of Shoulder Peak Detection       3                                                              3-1.  Basic Peak Detection Parameters
                                                                       2
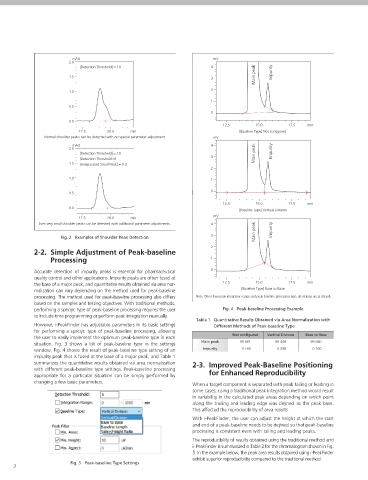
            2-2.  Simple Adjustment of Peak-baseline                                                                                  The basic parameters that allow the user to adjust peak detection condi-  14.00  14.50  15.00  14.00  14.50  15.00
                  Processing                                           1                                                              tions  are  the  peak-baseline  type  mentioned  above,  peak  detection   [Minimum Half Width] = 5  [Minimum Half Width] = 10
                                                                                                                                      threshold, and peak integration range. Using the detection threshold set-
                                                                                                                                      ting, the peaks below a certain threshold are not detected based on the   Fig. 8  Example Con guration of Minimum FWHM
            Accurate  detection  of  impurity  peaks  is  essential  for  pharmaceutical   0                                          estimated noise level calculated using a proprietary algorithm. Decreas-  (2) To Ensure Peak Area Accuracy and Linearity [Peak Baseline Height]
            quality control and other applications. Impurity peaks are often fused at                                                 ing the peak detection threshold value allows the detection of smaller
            the base of a major peak, and quantitative results obtained via area nor-  12.5  15.0  17.5  min                          peaks. The peak integration range specifies the time range during which   With tailing peaks and chromatograms with a large amount of baseline
                                                                                                                                                                                           noise, the peak start and end points can vary depending on the data,
            malization can vary depending on the method used for peak-baseline   [Baseline Type] Base to Base                         peaks will be detected. Fig. 6 shows the change in results produced by   which can reduce area accuracy. By using the peak-baseline height set-
            processing. The method used for peak-baseline processing also differs   Note: Other than peak integration range and peak-baseline processing type, all settings are at default.  changing the peak detection threshold from the default setting of 5 to   ting, the peak start and end points are recognized as the product of a
            based on the samples and testing objectives. With traditional methods,                                                    2,000. These intuitive controls allow the user to detect or not to detect   value entered for peak-baseline height and noise intensity calculated
            performing a speciÿc type of peak-baseline processing requires the user   Fig. 4  Peak-baseline Processing Example        small peaks with a simple adjustment. Fig. 7 shows an example of adjust-  using a proprietary algorithm. Consequently, the larger the peak-base-
            to include time programming or perform peak integration manually.                                                         ing the peak integration range. Without adjusting the peak integration   line height value is, the higher the peak-baseline is positioned.
                                                                  Table 1  Quantitative Results Obtained via Area Normalization with  range, all peaks fall within the range and the peak-baseline is affected by
            However, i-PeakFinder has adjustable parameters in its basic settings   Different Methods of Peak-baseline Type           negative peaks. Setting the peak integration range to exclude negative   Using this setting provides good reproducibility in the determination of
            for performing a speciÿc  type of peak-baseline processing, allowing                                                      peaks allows the user to configure an appropriate baseline.  peak- baseline start and end points. This improves peak area reproducibil-
            the user to easily implement the optimum peak-baseline type in each   Not con gured  Vertical Division  Base to Base                                                           ity, as mentioned earlier in Table 2, and provides linearity across results
            situation.  Fig.  3  shows  a  list  of  peak-baseline  type  in  the  settings   Main peak  99.681  99.448  99.680           30 mAU                 30 mAU                    obtained  for  a  target  component  at  different  concentrations.  Fig.  9
                                                                                                                                                                                           shows an example configuration of peak-baseline height where the base-
            window, Fig. 4 shows the result of peak-baseline type setting of an   Impurity  0.160  0.338  0.160                           25                     25                        line length of the tailing peaks is adjusted by specifying the peak-baseline
            impurity peak that is fused at the base of a major peak, and Table 1                                                          20                     20                        height.
            summarizes the quantitative results obtained via area normalization   2-3.  Improved Peak-Baseline Positioning                15                     15
            with different peak-baseline type settings. Peak-baseline processing   for Enhanced Reproducibility                           10                     10
            appropriate  for  a  particular  situation  can  be  simply  performed  by                                                     5                     5
            changing a few basic parameters.                                                                                               0                     0
                                                                 When a target component is separated with peak tailing or leading in        1.0   2.0  min        1.0   2.0   min
                                                                 some cases, using a traditional peak integration method would result   [Detection Threshold] = 5 (default value)  [Detection Threshold] = 2000
                                                                 in variability in the calculated peak areas depending on which point              Fig. 6  Peak Detection Threshold
                                                                 along the trailing and leading edge was deÿned  as the peak base.                                                                   15.0      min     15.0      min
                                                                 This affected the reproducibility of area results.                                                                                     [Peak Baseline Height] Not conÿgured
                                                                 With i-PeakFinder, the user can adjust the height at which the start
                                                                 and end of a peak-baseline needs to be deÿned so that peak-baseline
                                                                 processing is consistent even with tailing and leading peaks.
                                                                 The reproducibility of results obtained using the traditional method and
                                                                 i- PeakFinder is summarized in Table 2 for the chromatogram shown in Fig.
                                                                                                                                                                     5.0
                                                                                                                                                                         10.0
                                                                                                                                                                               min
                                                                                                                                                   10.0
                                                                                                                                              5.0
                                                                                                                                                        min
                                                                 5. In the example below, the peak area results obtained using i-PeakFinder   [Peak Integration Range] Not conÿgured  [Peak Integration Range] ° 4.1 (min)  15.0  min  15.0  min
                                                                 exhibit superior reproducibility compared to the traditional method.                                                                      [Peak Baseline Height] = 50
                        Fig. 3  Peak-baseline Type Settings                                                                                         Fig. 7  Peak Integration Range
      2                                                                                                                                                                                    Fig. 9  Example Con guration of Peak-Baseline Height for Tailing Peaks  3
   57   58   59   60   61   62   63   64   65   66   67