
Page 66 - LC-SFC_Pharma_Brochure
P. 66
mAU
2. Examples of i-DReC Applications 554 nm
300
2-1. Extending the Linear Dynamic
Range of Calibration Curves
200
This section demonstrates the extension of a calibration curve's
linearity into a high concentration range, using standard solutions
100
of Rhodamine with concentrations ranging from 0.01 g/L to 10
g/L. The following conditions were used for analysis. 347 nm
Analytical Conditions 0
Pump : Shimadzu LC-30AD×2 200 300 400 500 600 nm
Detector : Shimadzu SPD-M30A Fig. 2 Spectrum of Rhodamine
Column oven : Shimadzu CTO-20AC
Controller : Shimadzu CBM-20Alite Area (×10 ) 6
Autosampler : Shimadzu SIL-30AC
Mobile phase : Ammonium formate buffer 45% / ACN 55% 70
Column : Shimadzu Shim-pack VP-ODS
(4.6 mmL. × 150 mmI.D., 5.0 µm)
60
Flow rate : 1 mL/min
Column temp. : 40 °C
Sampling : 80 msec 50
Slit width : 1 nm
Time constant : 80 msec
40
Wavelength range : 190 nm-700 nm
Cell light path : 10 mm
Injection volume : 2 µL 30
Calibration points lose linear
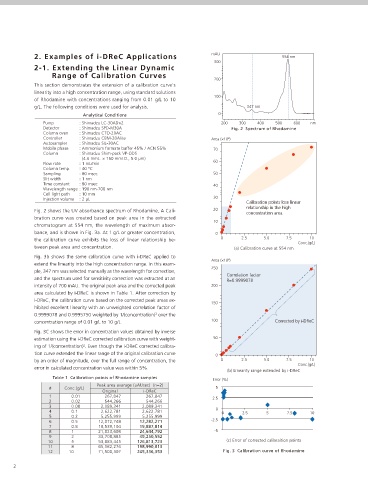
Fig. 2 shows the UV absorbance spectrum of Rhodamine, A Cali- 20 relationship in the high
concentration area.
bration curve was created based on peak area in the extracted
10
chromatogram at 554 nm, the wavelength of maximum absor-
bance, and is shown in Fig. 3a. At 1 g/L or greater concentration, 0
the calibration curve exhibits the loss of linear relationship be- 0 2.5 5.0 7.5 10
Conc.(g/L)
tween peak area and concentration. (a) Calibration curve at 554 nm
Fig. 3b shows the same calibration curve with i-DReC applied to
Area (×10 ) 6
extend the linearity into the high concentration range. In this exam-
250
ple, 347 nm was selected manually as the wavelength for correction,
Correlation factor
and the spectrum used for sensitivity correction was extracted at an R=0.9999078
intensity of 700 mAU. The original peak area and the corrected peak 200
area calculated by i-DReC is shown in Table 1. After correction by
i-DReC, the calibration curve based on the corrected peak areas ex-
150
hibited excellent linearity with an unweighted correlation factor of
0.9999078 and 0.9995750 weighted by 1/(concentration) over the
2
concentration range of 0.01 g/L to 10 g/L. 100 Corrected by i-DReC
Fig. 3C shows the error in concentration values obtained by inverse
estimation using the i-DReC corrected calibration curve with weight- 50
ing of 1/(concentration) . Even though the i-DReC corrected calibra-
2
tion curve extended the linear range of the original calibration curve 0
by an order of magnitude, over the full range of concentration, the 0 2.5 5.0 7.5 10
Conc.(g/L)
error in calculated concentration value was within 5%.
(b) Linearity range extended by i-DReC
Table 1 Calibration points of Rhodamine samples
Error (%)
Peak area avarage (uAUsec) (n=2)
# Conc.(g/L) 5
Original i-DReC
1 0.01 267,847 267,847 2.5
2 0.02 544,266 544,266
3 0.08 2,089,341 2,089,341
4 0.1 2,622,781 2,622,781 0 0 2.5 5 7.5 10
5 0.2 5,255,999 5,255,999
6 0.5 12,072,748 12,282,271 -2.5
7 0.8 18,539,104 19,887,814
8 1 21,823,608 24,644,792 -5
9 2 33,708,885 49,250,552
10 5 53,883,445 126,813,723 (c) Error of corrected calibraition points
11 8 65,182,276 198,990,013
12 10 71,500,307 245,336,353 Fig. 3 Calibration curve of Rhodamine
2