Page 60 - LC-SFC_Pharma_Brochure
P. 60

i-DReC


                                                                  Area (×10 )
                                                                         6
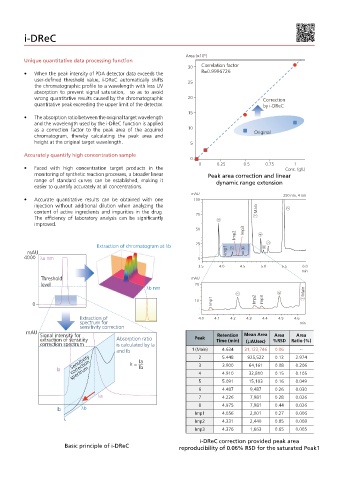
          Unique quantitative data processing function
                                                                   30   Correlation factor
          •  When the peak intensity of PDA detector data exceeds the   R=0.9996726
             user-defined  threshold  value,  i-DReC  automatically  shifts  25
             the chromatographic profile to a wavelength with less UV
             absorption  to  prevent  signal  saturation,    so  as  to  avoid
             wrong quantitative results caused by the chromatographic  20                    Correction
             quantitative peak exceeding the upper limit of the detector.                    by i-DReC
                                                                   15
          •  The absorption ratio between the original target wavelength
             and the wavelength used by the i-DReC function is applied
             as  a  correction  factor  to  the  peak  area  of  the  acquired  10        Original
             chromatogram,  thereby  calculating  the  peak  area  and
             height at the original target wavelength.              5

          Accurately quantify high concentration sample
                                                                    0
                                                                       0     0.25      0.5    0.75      1
          •  Faced  with  high  concentration  target  products  in  the                             Conc. (g/L)
             monitoring of synthetic reaction processes, a broader linear  Peak area correction and linear
             range  of  standard  curves  can  be  established,  making  it  dynamic range extension
             easier to quantify accurately at all concentrations.
                                                                    mAU                              250 nm, 4 nm
          •  Accurate  quantitative  results  can  be  obtained  with  one  100
             injection  without  additional  dilution  when  analyzing  the
             content  of  active  ingredients  and  impurities  in  the  drug.  75            Main
             The  efficiency  of  laboratory  analysis  can  be  significantly
             improved.
                                                                      50               Imp3
                                                                                    Imp2
                                   Extraction of chromatogram at λb   25
           mAU                                                                   Imp1
          4000 λa nm                                                   0
                                                                       3.5    4.0    4.5     5.0    5.5    6.0
                                                                                                           min
               Threshold                                            mAU
               level                                                 20
                                                    λb nm                                                      Main
                                                                     10    Imp1            Imp2  Imp3
            0

                             Extraction of                             4.0  4.1   4.2   4.3  4.4   4.5  4.6
                             spectrum for                                                                 min
                             sensitivity correction
          mAU
               Signal intensity for                                          Retention  Mean Area   Area  Area
               extraction of sensitiity   Absorption ratio           Peak    Time (min)  (µAUsec)  %RSD  Ratio (%)
               correction spectrum        is calculated by Ia
                                          and Ib                    1 (Main)   4.634   31,123,746  0.06   --
                           Sensitivity         k =  Ia                 2 3     5.448    925,522   0.12   2.974

                                                                                        64,161
                                                                                                  0.08
                                                                                                         0.206
                                                                               3.900
                          spectrum
                     Ia    correction             Ib                   4       4.910    32,810    0.15   0.105
                                                                       5       5.091    15,103    0.16   0.049
                                                                       6       4.487     9,487    0.26   0.030
                                   λa                                  7       4.226     7,981    0.28   0.026
                                                                       8       4.975     7,981    0.44   0.026
                     Ib       λb
                                                                      Imp1     4.056     2,001    0.27   0.006
                       λ                                              Imp2     4.331     2,440    0.85   0.008
                                                                      Imp3     4.376     1,663    0.65   0.005
                                                                       i-DReC correction provided peak area
                        Basic principle of i-DReC               reproducibility of 0.06% RSD for the saturated Peak1
   55   56   57   58   59   60   61   62   63   64   65