
Page 37 - Application Handbook - Liquid Chromatography
P. 37
LAAN-J-LC-E105
LC
Liquid Chromatograph
Analysis of Melamine and Its
32 Related Substances in Fertilizers
Recently, it has been confirmed that some granulated products of hydrated calcium cyanamide, which are created
by adding water to calcium cyanamide, contain a significant amount of melamine. Given this fact, while there are at
present no standard values for melamine in fertilizer, regulations are being discussed, and investigations are
progressing with respect to the dynamics of melamine in soil and its transition to crops.
This article introduces an example of the analysis of melamine and related substances in fertilizers using an HPLC
system, with reference to the fertilizer test methods (2012) under the supervision of the Japan‘s Food and
Agricultural Materials Inspection Center (FAMIC). (A. Uchida, T. Yamaguchi)
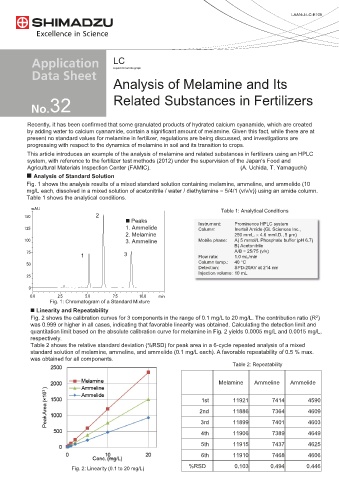
Analysis of Standard Solution
Fig. 1 shows the analysis results of a mixed standard solution containing melamine, ammeline, and ammelide (10
mg/L each, dissolved in a mixed solution of acetonitrile / water / diethylamine = 5/4/1 (v/v/v)) using an amide column.
Table 1 shows the analytical conditions.
mAU Table 1: Analytical Conditions
150 2
Peaks Instrument: Prominence HPLC system
125 1. Ammelide Column: Inertsil Amide (GL Sciences Inc.,
2. Melamine 250 mmL. × 4.6 mmI.D., 5 µm)
100 3. Ammeline Mobile phase: A) 5 mmol/L Phosphate buffer (pH 6.7)
B) Acetonitrile
75 3 A/B = 25/75 (v/v)
1 Flow rate: 1.0 mL/min
Column temp.: 40 °C
50
Detection: SPD-20AV at 214 nm
Injection volume: 10 mL
25
0
0.0 2.5 5.0 7.5 10.0 min
Fig. 1: Chromatogram of a Standard Mixture
Linearity and Repeatability
2
Fig. 2 shows the calibration curves for 3 components in the range of 0.1 mg/L to 20 mg/L. The contribution ratio (R )
was 0.999 or higher in all cases, indicating that favorable linearity was obtained. Calculating the detection limit and
quantitation limit based on the absolute calibration curve for melamine in Fig. 2 yields 0.0005 mg/L and 0.0015 mg/L,
respectively.
Table 2 shows the relative standard deviation (%RSD) for peak area in a 6-cycle repeated analysis of a mixed
standard solution of melamine, ammeline, and ammelide (0.1 mg/L each). A favorable repeatability of 0.5 % max.
was obtained for all components.
was obtained for all components.
Table 2: Repeatability
Melamine Ammeline Ammelide
1st 11921 7414 4590
2nd 11886 7364 4609
3rd 11899 7401 4603
4th 11906 7389 4649
5th 11915 7437 4625
6th 11910 7468 4606
Fig. 2: Linearity (0.1 to 20 mg/L) %RSD 0.103 0.494 0.446