Page 12 - LifeScience Solution for FNIRS
P. 12

For Research Use Only. Not for use in diagnostic procedures.

            Simultaneous Measurement with EEG                                                                                                                                                                                                   Light to Measure Brain Function  Principle of Using Near Infrared


               Data                                                                                                                                                                                                                             Imaging  Optical Brain-Function


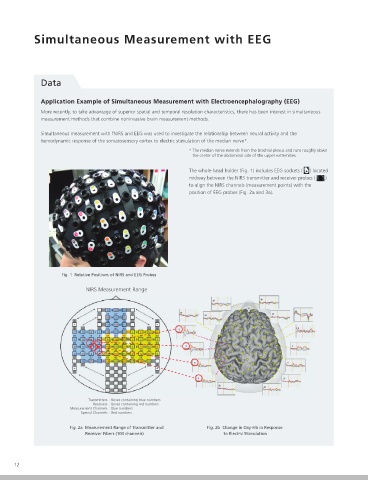
               Application Example of Simultaneous Measurement with Electroencephalography (EEG)                                                                                          Stim.               Stim.
                                                                                                                                                       EEG Measurement Range
               More recently, to take advantage of superior spatial and temporal resolution characteristics, there has been interest in simultaneous                                          P22  P47           P22  P47
               measurement methods that combine noninvasive brain measurement methods.

               Simultaneous measurement with fNIRS and EEG was used to investigate the relationship between neural activity and the                                                                                                             bilitation  Neuroreha-
               hemodynamic response of the somatosensory cortex to electric stimulation of the median nerve*.

                                                                * The median nerve extends from the brachial plexus and runs roughly down
                                                                   the center of the abdominal side of the upper extremities.

                                                                The whole-head holder (Fig. 1) includes EEG sockets (     ) located                                                                                                             fNIRS and fMRI  Comparison of
                                                                midway between the NIRS transmitter and receiver probes (       )
                                                                to align the NIRS channels (measurement points) with the
                                                                position of EEG probes (Fig. 2a and 3a).                                                                                                                                        Motor Control  Brain Activity during


                                                                                                                                               Fig. 3a  Measurement Range of EEG Probes (32 channels)  Fig. 3b  Somatosensory Evoked Electric Potential
                                                                                                                                                                                                  in Response to Electric Stimulation           Measurement with EEG  Simultaneous


                     Fig. 1  Relative Positions of NIRS and EEG Probes                                                                                                                                                                          Analysis Method  NIRS Signal

                              NIRS Measurement Range


                                                                                                                                                  0 sec                    1 sec                  3 sec                   5 sec                 Inner Speech  Investigating
                                                                                                                                                               Fig. 4  Brain Activity at Indicated Time (sec) Intervals After Electric Stimulation
                                                                                                                                        Of all the locations where Oxy-Hb (Fig. 2b) and somatosensory evoked electric potential (Fig. 3b) were measured, the somatosensory
                                                                                                                                        evoked potential at P22 (positive wave at 22 ms of latency) increased in the primary somatosensory cortex of the ear (left) on the
                                                                                                                                        opposite side from the side that was electrically stimulated (Fig. 3a and 3b).                          Functions  Language Processing
                                                                                                                                        In addition, Oxy-Hb increased in the primary somatosensory cortex of the opposite ear from the electrical stimulation 5 seconds after
                                                                                                                                        the electrical stimulation (Fig. 4).
                                                                                                                                        Simultaneous measurement using NIRS and EEG is especially effective for investigating the correlation between hemodynamic response
                                                                                                                                        and neural activity.

                                                                                                                                        (Data provided by: Mr. Hisao Nishijo, Graduate School of Medicine and Pharmaceutical Sciences for Research, University of Toyama)  Research  Mental Disorder
                              Transmitters : Boxes containing blue numbers                                                              Reference: Takeuchi., M, Hori, E., Takamoto, K., Tran, A.H., Kohno, S., Ishikawa, A., Ono, T., Endo, S. and Nishijo, H. (2009)
                                Receivers : Boxes containing red numbers                                                                                 "Brain cortical mapping by simultaneous recording of functional near infrared spectroscopy and electroencephalograms from the whole brain during
                        Measurement Channels : Blue numbers
                            Special Channels : Red numbers                                                                                               right median nerve stimulation." Brain Topogr, 22, 197–214.

                        Fig. 2a  Measurement Range of Transmitter and   Fig. 2b  Change in Oxy-Hb in Response                                                                                                                                   Shimadzu fNIRS   Key References Regarding
                                      Receiver Fibers (103 channels)       to Electric Stimulation


      12                                                                                                                                                                                                                                       13
   7   8   9   10   11   12   13   14   15   16   17