
Page 15 - LifeScience Solution for FNIRS
P. 15
For Research Use Only. Not for use in diagnostic procedures.
NIRS Signal Analysis Method Light to Measure Brain Function Principle of Using Near Infrared
Data Imaging Optical Brain-Function
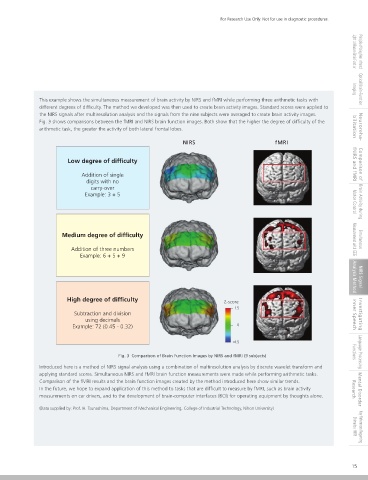
Various non invasive methods are available to measure brain activity. One of these, functional magnetic resonance imaging (fMRI), has This example shows the simultaneous measurement of brain activity by NIRS and fMRI while performing three arithmetic tasks with
helped clarify higher order brain functions such as cognition and language. However, fMRI does not permit the subject's body, the different degrees of difficulty. The method we developed was then used to create brain activity images. Standard scores were applied to
head in particular, to move during measurements, which is problematic for brain function measurements in natural situations. At the the NIRS signals after multiresolution analysis and the signals from the nine subjects were averaged to create brain activity images.
same time, interests in near-infrared spectroscopy (NIRS) has increased in recent years. As NIRS permits brain function measurements in Fig. 3 shows comparisons between the fMRI and NIRS brain function images. Both show that the higher the degree of difficulty of the
natural situations, it may support applications that fMRI cannot address. There is much debate about how to interpret signals obtained arithmetic task, the greater the activity of both lateral frontal lobes. bilitation Neuroreha-
by NIRS, and it is problematic that no statistical signal processing method has yet been determined. Signals obtained by NIRS contain
noise from the measurement instrument and effects from the subject's pulse, breathing and blood pressure fluctuations. Relative NIRS fMRI
changes in NIRS signal values after the start of measurements make it difficult to compare data between subjects or to evaluate
general trends during tasks.
Low degree of difficulty fNIRS and fMRI Comparison of
Signal Processing by Multiresolution Analysis and Applying Standard Scores Addition of single
digits with no
A method is required to eliminate the signals unrelated to brain activity and to evaluate general brain activities during tasks. We have carry-over
developed such a method. In the method, multiresolution analysis by discrete wavelet transform divides the NIRS signals into various Example: 3 + 5
frequency components, as shown in Fig. 1 The signal components corresponding to the task are then extracted and the signals are Motor Control Brain Activity during
expressed as standard scores.
Raw signal S
Medium degree of difficulty
a 1 Measurement with EEG Simultaneous
d 1
(Low-frequency components) (High-frequency components) Addition of three numbers
Example: 6 + 5 + 9
a 2 d 2
Frequency components related to task Analysis Method NIRS Signal
a 3 d 3
Fig. 1 Multiresolution Analysis High degree of difficulty Z-score
1.5
Fig. 2 shows a comparison between the raw signals and the signal components related to brain activity that were extracted by Subtraction and division Inner Speech Investigating
multiresolution analysis and reconstructed. It is apparent that the analyzed signals more clearly show the Oxy-Hb and Deoxy-Hb using decimals
fluctuations. Example: 72 (0.45 - 0.32) 0
0.06
Oxy-Hb Deoxy-Hb -1.5
0.04
Hb concentration fluctuations (mM cm) -0.02 Introduced here is a method of NIRS signal analysis using a combination of multiresolution analysis by discrete wavelet transform and
Raw signal 0.02 0 Fig. 3 Comparison of Brain Function Images by NIRS and fMRI (9 subjects) Functions Language Processing
-0.04
-0.06
0 40 80 120 160 200 240 280 320 360 400 440 480 520 560 Time (s) applying standard scores. Simultaneous NIRS and fMRI brain function measurements were made while performing arithmetic tasks.
Comparison of the fMRI results and the brain function images created by the method introduced here show similar trends.
0.03
In the future, we hope to expand application of this method to tasks that are difficult to measure by fMRI, such as brain activity Research Mental Disorder
0.02
Hb concentration -0.01
After 0.01 measurements on car drivers, and to the development of brain-computer interfaces (BCI) for operating equipment by thoughts alone.
multiresolution 0 (Data supplied by: Prof. H. Tsunashima, Department of Mechanical Engineering, College of Industrial Technology, Nihon University)
analysis fluctuations (mM cm)
-0.02
-0.03
0 40 80 120 160 200 240 280 320 360 400 440 480 520 560 Time (s) Shimadzu fNIRS Key References Regarding
Fig. 2 Comparison of Raw Signals and Signals After Multiresolution Analysis
14 15