Page 42 - Pharmaceutical- Guide to Biopharmaceutical
P. 42

Characterization                Quality Control


                     Evaluating the Thermal Stability of Proteins                                                                       DSC-60 Plus


                               Using a Differential Scanning Calorimeter to                                                                                benefits

                                 Measure the Thermal Stability of Proteins                                                                                                                                                                   Cell Line Optimization
                                                                                                 click here                                     •  The thermal stability of proteins can be easily evaluated.
                                                                                                                                                •  The stability due to pH or solvent differences can be evaluated.
                     Operating Principle and Features                DSC
                                                                     mW                                                                         •   With the built-in liquid nitrogen cooling chamber, the system can be used to evaluate
                     A differential scanning calorimeter (DSC) can measure the enthalpy                                                           the protein effects of freezing.
                     changes in heat energy generated (endothermic or exothermic) as a
                     sample is heated or cooled. Sample and reference solutions are placed   0.20                                                                                                                                            Culture
                     in approx. 6 mm diameter cells, with the cells placed in thermally
                     symmetric positions within the furnace, and then the furnace is heated
                     or cooled at a constant rate. For example, when proteins are heated at
                     a constant rate, denaturation can cause the three-dimensional structure   0.00
                     to begin unfolding. DSC systems can measure the thermal changes that
                     occur during that process as endothermic peaks (thermal denaturation   74.9 ゚C
                     temperatures). Due to its superior baseline stability, the DSC-60 Plus
                     can easily measure the thermal changes of samples in solution.  -0.20

                     Operating Procedure and Measurement                  40.00     60.00    80.00     100.00                                                                                                                                Purification
                     Conditions                                              Fig. 1   Endothermic Peak of 2.5 % Lysozyme Solution
                                                                                       Temp [゚C ]

                     Samples were prepared by diluting lysozyme from chicken egg white
                     with a phosphate buffer solution (pH 7.05) to the concentrations   DSC
                     indicated in Table 1. Then, 20 µL of the sample was sealed with an   mW
                     aluminum hermetic cell. Using 20 μL of the phosphate buffer solution as   0.10
                     a reference sample, the samples were heated from 35 to 105 °C at a rate
                     of 5 °C per minute to measure the thermal denaturation temperatures.
                     To investigate the effect of protein pH, three 0.2 mol/L phosphate
                     buffer solutions with pH 4.20, pH 7.05, and pH 9.10, were used as                                                                                                                                                       Characterization
                     solvents for preparing and measuring the 10 % lysozyme solutions.   0.00
                     The temperature was increased from 40 to 100 °C at a rate of 5 °C per   75.1 ゚ C
                     minute.
                                     Table 1   Samples Used
                     Sample           Concentration
                     Lysozyme in Fig. 1  2.5 % of protein          -0.10
                     Lysozyme in Fig. 2  0.2 % of protein                                                                               Specifications
                                                                          40.00     60.00    80.00     100.00
                                                                                        Temp [゚C ]
                     Results                                                 Fig. 2   Endothermic Peak of 0.2 % Lysozyme Solution        Instrument              DSC-60 Plus                                                                 Quality Control
                                                                                                                                         Method                  Heat flow
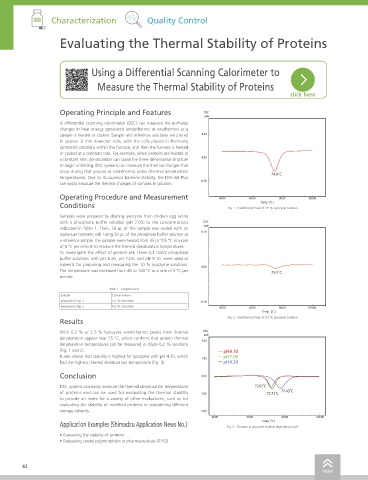
                     With 0.2 % or 2.5 % lysozyme, endothermic peaks from thermal   DSC
                                                                    mW                                                                   Measurement temperature range  -140 to 600 °C (when using liquid nitrogen with cooling chamber included standard)
                     denaturation appear near 75 °C, which confirms that protein thermal
                                                                    2.00
                     denaturation temperatures can be measured in dilute 0.2 % solutions                                                 Heat measurement range  ±150 mW
                     (Fig. 1 and 2).                                     ー pH9.10                                                        Baseline noise          0.5 μW max. (RMS value for a blank held at 150 °C)
                     It also shows that stability is highest for lysozyme with pH 4.20, which   ー pH7.05
                                                                    1.00                                                                 Atmosphere              Nitrogen, inert gas, or dry air gas flow
                     had the highest thermal denaturation temperature (Fig. 3).  ー pH4.20
                                                                                                                                         External dimensions     W 320 mm × D 500 mm × H 290 mm
                     Conclusion                                     0.00                                                                 Weight                  28 kg
                                                                                                                                                                                                                                             Pharmacokinetics
                     DSC systems can easily measure the thermal denaturation temperatures   72.01゚C                                      Power requirement       100 / 120 / 220 / 230 / 240 V AC ±10 %, 50/60 Hz, 800 VA
                     of proteins and can be used for evaluating the thermal stability   -1.00  72.72゚C  77.43゚C                          Optional                SSCP-1 sample sealer and crimp press
                     to provide an index for a variety of other evaluations, such as for                                                                         Cell compatible with crimp attachment *1
                     evaluating the stability of modified proteins or considering different                                                                      Cell compatible with sealing attachment  *2
                     storage solvents.                             -2.00                                                                                         Aluminum crimped cell *1
                                                                                                                                                                 Aluminum sealed cell *2
                                                                       40.00       60.00      80.00       100.00
                     Application Examples (Shimadzu Application News No.)   Fig. 3   Changes in Lysozyme Stability depending on pH      *1 Used in Application News T152                                                                     Others
                                                                                        Temp [゚C ]
                                                                                                                                        *2 Used in Fig. 1 to 3 (p. 42)
                     • Evaluating the stability of proteins
                     • Evaluating crystal polymorphism in pharmaceuticals (T152)


        42                                                                                                                                                                                                                                  43
                                                                                                            index                                                                                                                  index
   37   38   39   40   41   42   43   44   45   46   47