
Page 25 - Pharmaceutical- Guide to Biopharmaceutical
P. 25
Characterization Quality Control
Analysis of Product Peptide Fragments LC-2060 Series
Using Integrated UHPLC System with High benefits
Repeatability for Mapping Peptides in Antibody Drugs Cell Line Optimization
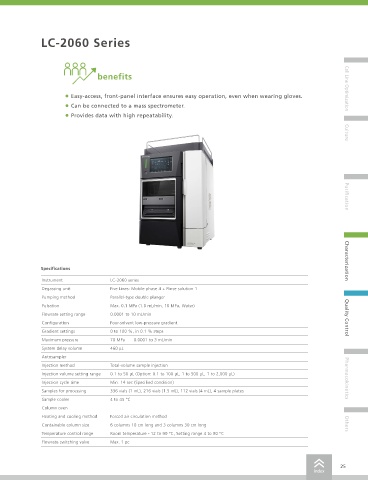
click here • Easy-access, front-panel interface ensures easy operation, even when wearing gloves.
• Can be connected to a mass spectrometer.
Operating Principle and Features
10 mg/mL Human IgG in water 20 µL • Provides data with high repeatability.
Using HPLC for peptide mapping requires a system with high 6 mol/L Guanidine hydrochloride in
repeatability, because the analysis involves comparing elution profiles 0.25 mol/L Tris buffer (pH 7.5) 80 µL
to confirm whether peptides are identical or have mutations. LC-2060 0.5 mol/L Dithiothreitol in water 2 µL Culture
series integrated UHPLC systems are ideal for such analysis.
Incubate at 37 ˚C for 30 min
Measurement Method and Conditions 0.5 mol/L Iodoacetamide in water 4.8 µL
Samples were prepared by reduction, alkylation, and then trypsin Incubate at room temperature for 30 min in the dark
enzyme digestion of human immunoglobulin G (IgG) (Fig. 1) and 0.5 mol/L Dithiothreitol in water 2 µL
analyzed according to the analytical conditions in Table 1.
0.25 mol/L Tris buffer (pH 7.5) 700 µL
Results 1 mg/mL Trypsin in 1 mmol/L HCl 4 µL
The chromatogram from the trypsin-digested IgG shows that an Incubate at 37 ˚C for 20 hours Purification
extremely large number of peaks are detected and separated (Fig. Tri uoroacetic acid 1 µL
2). For peptide mapping, an extremely long gradual gradient is used Inject to UHPLC
to separate the many peaks. Consequently, results tend to have
poor repeatability, especially if using a low-pressure gradient system. Fig. 1 Pretreatment Process Flow
Therefore, the intra-day and inter-day repeatability were also checked. 4.5 mAU (×10)
Key peaks (a to f) were selected from the chromatogram. Intra-day
repeatability was calculated from six consecutive analysis results. Inter- 4.0
day repeatability was calculated from the daily average values of three
analyses on each of six days (Tables 2 and 3). Both the intra-day and 3.5
inter-day repeatability values indicated good reproducibility. Characterization
3.0 Specifications
Table 1 Analytical Conditions
2.5
Column: Aeris PEPTIDE XB-C18 100 Å Instrument LC-2060 series
(150 mm × 2.0 mm I.D., 1.7 μm)
Mobile phase A: 0.1 % Trifluoroacetic acid in water 2.0 Degassing unit Five Lines: Mobile phase 4 + Rinse solution 1
Mobile phase B: 0.08 % Trifluoroacetic acid in acetonitrile Pumping method Parallel-type double plunger
Time Program: 0 % (0 min) → 45 % (90 min) → 1.5
(B. Conc.) → 100 % (90.01 – 95 min) → Pulsation Max. 0.1 MPa (1.0 mL/min, 10 MPa, Water)
→ 0 % (95.01 – 110 min) 1.0
Flowrate: 0.2 mL/min Flowrate setting range 0.0001 to 10 mL/min
Column Temp.: 60 °C 0.5 Configuration Four-solvent low-pressure gradient Quality Control
Injection Volume: 10 µL
Detection: PDA (215 nm) 0.0 Gradient settings 0 to 100 %, in 0.1 % steps
Flow Cell: High-speed high-sensitivity cell
0.0 25.0 50.0 75.0 min Maximum pressure 70 MPa 0.0001 to 3 mL/min
Fig. 2 Chromatogram of IgG Trypsin Digestion Products
Conclusion Table 2 Intra-day Repeatability of Retention Times (n = 6) System delay volume 460 µL
Peak Avg. R.T. (min) Std. Dev. (min) %RSD (%) Autosampler
LC-2060 series systems provide data with excellent repeatability even Peak a 9.929 0.027 0.271 Injection method Total-volume sample injection
when using analytical conditions prone to cause poor repeatability in Peak b 24.669 0.047 0.192
low-pressure gradient systems. They can also be connected to a mass Peak c 36.299 0.042 0.117 Injection volume setting range 0.1 to 50 μL (Option: 0.1 to 100 μL, 1 to 500 μL, 1 to 2,000 μL)
spectrometer for peptide mapping. Peak d 48.815 0.033 0.068 Injection cycle time Min. 14 sec (Specified condition) Pharmacokinetics
Peak e 59.864 0.032 0.054
Application Examples Peak f 74.535 0.043 0.057 Samples for processing 336 vials (1 mL), 216 vials (1.5 mL), 112 vials (4 mL), 4 sample plates
Sample cooler 4 to 45 °C
• High-sensitivity analysis using a fluorescence detector Table 3 Intra-day Repeatability of Retention Times (n = 6) Column oven
• Various UHPLC analyses Peak Avg. R.T. (min) Std. Dev. (min) %RSD (%)
Peak a 9.907 0.016 0.159 Heating and cooling method Forced air circulation method
Peak b 24.708 0.033 0.132
Containable column size 6 columns 10 cm long and 3 columns 30 cm long Others
Peak c 36.355 0.034 0.093
Peak d 48.877 0.034 0.093 Temperature control range Room temperature - 12 to 90 °C, Setting range 4 to 90 °C
Peak e 59.901 0.027 0.046
Peak f 74.555 0.036 0.049 Flowrate switching valve Max. 1 pc
24 25
index index