Page 28 - Pharmaceutical- Guide to Biopharmaceutical
P. 28

Characterization                Quality Control


                     Glycan Analysis                                                                                                    RF-20Axs


                               Analysis of Glycans by HPLC Detection                                                                                       benefits

                                    of Fluorescence-Marked Glycans                                                                                                                                                                           Cell Line Optimization
                                                                                                 click here                                     •   The low noise and excellent S/N ratio ensure ample sensitivity for glycan analysis.
                                                                                                                                                •   Cell temperature control functionality enables highly reproducible data acquisition.
                     Operating Principle and Features              Measurement Method and Conditions
                                                                                                                                                •   Standard, semi-micro, inert, and other cells can be selected based on the given analysis.
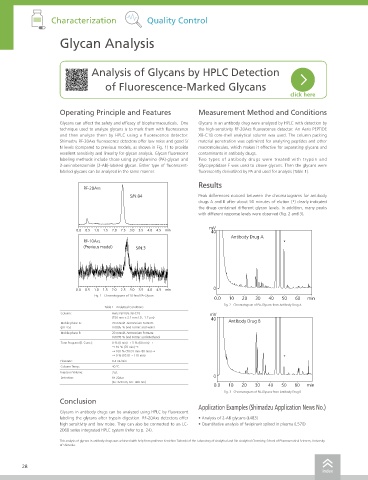
                     Glycans can affect the safety and efficacy of biopharmaceuticals.  One   Glycans in an antibody drug were analyzed by HPLC with detection by
                     technique used to analyze glycans is to mark them with fluorescence   the high-sensitivity RF-20Axs fluorescence detector. An Aeris PEPTIDE
                     and then analyze them by HPLC using a fluorescence detector.   XB-C18 core-shell analytical column was used. The column packing                                                                                         Culture
                     Shimadzu RF-20Axs fluorescence detectors offer low noise and good S/  material penetration was optimized for analyzing peptides and other
                     N levels (compared to previous models, as shown in Fig. 1) to provide   macromolecules, which makes it effective for separating glycans and
                     excellent sensitivity and linearity for glycan analysis. Glycan fluorescent   contaminants in antibody drugs.
                     labeling methods include those using pyridylamino (PA)-glycan and   Two types of antibody drugs were treated with trypsin and
                     2-aminobenzamide (2-AB)-labeled glycan. Either type of fluorescent-  Glycopeptidase F was used to cleave glycans. Then the glycans were
                     labeled glycans can be analyzed in the same manner.  fluorescently derivatized by PA and used for analysis (Table 1).
                                                                   Results
                             RF-20AXS
                                            S/N:84                 Peak differences noticed between the chromatograms for antibody                                                                                                           Purification
                                                                   drugs A and B after about 50 minutes of elution (*) clearly indicated
                                                                   the drugs contained different glycan levels. In addition, many peaks
                                                                   with different response levels were observed (Fig. 2 and 3).
                                                                      mV
                          0.0  0.5  1.0  1.5  2.0  2.5  3.0  3.5  4.0  4.5  min  40
                                                                      mV      Antibody Drug A
                             RF-10AXL                                  40                      *
                             (Previous model)  S/N:3                          Antibody Drug A
                                                                                               *                                                                                                                                             Characterization


                                                                        0
                          0.0  0.5  1.0  1.5  2.0  2.5  3.0  3.5  4.0  4.5  min
                                Fig. 1   Chromatograms of 10 fmol PA-Glycan
                                                                        0 0.0  10  20  30  40  50  60  min
                                                                       mV  Fig. 2   Chromatogram of PA-Glycans from Antibody Drug A
                                    Table 1   Analytical Conditions     0.0  10  20   30  40  50   60  min
                                                                       40
                     Column:          Aeris PEPTIDE XB-C18             mV    Antibody Drug B
                                      (150 mm × 2.1 mm I.D., 1.7 μm)   40                                                               Specifications                                                                                       Quality Control
                     Mobile phase A:  20 mmol/L Ammonium Formate             Antibody Drug B
                     (pH 4.5)         0.0095 % (v/v) Formic acid-water
                                                                                                                                         Instrument            RF-20Axs fluorescence detector
                     Mobile phase B:  20 mmol/L Ammonium Formate
                                      0.0095 % (v/v) Formic acid-Methanol                                                                Light source          Xenon lamp, low-pressure mercury lamp (To check wavelength accuracy)
                     Time Program (B. Conc.):  0 % (0 min) → 5 % (60 min) →
                                      → 10 % (70 min) →                                        *                                         Wavelength range      Excitation wavelength from 200 to 900 nm, Fluorescence wavelength from 200 to 900 nm
                                      → 100 % (70.01 min- 80 min) →
                                      → 0 % (95.01 – 110 min)                                  *                                         Cell temperature control range  (Room temperature - 10 °C) to 40 °C
                     Flowrate:        0.4 mL/min                                                                                         Cell                  Standard conventional cell  Volume: 12 μL  Pressure capacity: 2 MPa
                     Column Temp.:    40 °C                             0
                     Injection Volume:  3 µL                                                                                                                   Optional semi-micro cell   Volume: 3 μL   Pressure capacity: 2 MPa
                                                                        0.0  10  20  30   40  50   60  min
                                                                        0
                     Detection:       RF-20Axs                                                                                                                                                                                               Pharmacokinetics
                                      (Ex: 320 nm, Em: 400 nm)                                                                                                 Optional inert cell        Volume: 12 μL  Pressure capacity: 2 MPa
                                                                        0.0  10  20  30   40  50   60  min
                                                                                                                                         Sampling rate         Max. 100 Hz (1 wavelength mode)
                                                                           Fig. 3   Chromatogram of PA-Glycans from Antibody Drug B
                     Conclusion                                                                                                          Function              Four-wavelength detection, wavelength scanning
                                                                   Application Examples (Shimadzu Application News No.)                  Operating environment  4 to 35 °C
                     Glycans in antibody drugs can be analyzed using HPLC by fluorescent                                                 Dimensions            W 260 mm × D 500 mm × H 210 mm
                     labeling the glycans after trypsin digestion. RF-20Axs detectors offer   • Analysis of 2-AB glycans (L483)
                     high sensitivity and low noise. They can also be connected to an LC-  • Quantitative analysis of favipiravir spiked in plasma (L570)  Weight  18 kg                                                                     Others
                     2060 series integrated HPLC system (refer to p. 24).                                                                Power requirement     100 to 240 V AC, 400 VA, 50/60 Hz
                     This analysis of glycans in antibody drugs was achieved with help from professor Kenichiro Tadoroki of the Laboratory of Analytical and Bio-Analytical Chemistry, School of Pharmaceutical Sciences, University
                     of Shizuoka.
        28                                                                                                                                                                                                                                  29
                                                                                                            index                                                                                                                  index
   23   24   25   26   27   28   29   30   31   32   33