Page 32 - Pharmaceutical- Guide to Biopharmaceutical
P. 32

Characterization                Quality Control


                     Glycan Analysis                                                                                                    MALDI-8020


                               Glycosylation Profile of IgGs Using a Linear Benchtop                                                                       benefits

                                    MALDI-TOF MS and Affinity Purification of Fc                                                                                                                                                             Cell Line Optimization
                                                                                                 click here                                     •  Enables rapid benchtop glycan profiling with minimal pretreatment.
                                                                                                                                                •  Easy maintenance and low running costs
                     Operating Principle and Features              Results
                                                                                                                                                •  Ideal for analyzing nucleic acids, proteins, and even polymers.
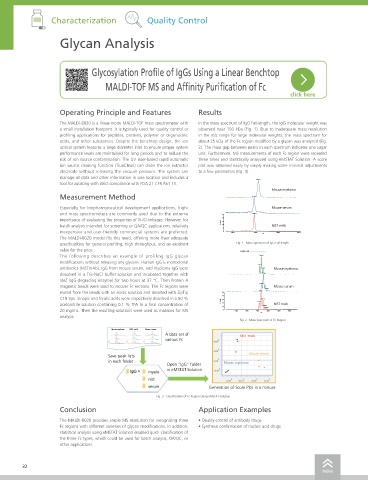
                     The MALDI-8020 is a linear-mode MALDI-TOF mass spectrometer with   In the mass spectrum of IgG full-length, the IgG molecular weight was
                     a small installation footprint. It is typically used for quality control or   observed near 150 kDa (Fig. 1). Due to inadequate mass resolution
                     profiling applications for peptides, proteins, polymer or oligonucleic   in the m/z range for large molecular weights, the mass spectrum for                                                                            Culture
                     acids, and other substances. Despite the benchtop design, the ion   about 25 kDa of the Fc region modified by a glycan was analyzed (Fig.
                     optical system features a large diameter inlet to ensure proper system   2). The mass gap between peaks in each spectrum indicates one sugar
                     performance levels are maintained for long periods and to reduce the   unit. Furthermore, MS measurements of each Fc region were repeated
                     risk of ion source contamination. The UV laser-based rapid automatic   three times and statistically analyzed using eMSTAT Solution. A score
                     ion source cleaning function (TrueClean) can clean the ion extractor   plot was obtained easily by simply making some minimal adjustments
                     electrode without releasing the vacuum pressure. The system can   to a few parameters (Fig. 3).
                     manage all data and other information in one location and includes a
                                                                                      156695.2
                     tool for assisting with strict compliance with FDA 21 CFR Part 11.
                                                                                           Mouse myeloma
                     Measurement Method                                             147269.0                                                                                                                                                 Purification

                     Especially for biopharmaceutical development applications, high-      Mouse serum
                     end mass spectrometers are commonly used due to the extreme   100  147795.6
                     importance of evaluating the properties of N-/O-linkages. However, for   % Intensity  80 60
                     batch analysis intended for screening or QA/QC applications, relatively   40  NIST mAb                             Specifications
                                                                           20
                     inexpensive and user-friendly commercial systems are preferred.   0  100000  150000  m/z  200000  250000
                     The MALDI-8020 model fits this need, offering more than adequate                                                    Instrument                   MALDI-8020
                     specifications for general profiling, high throughput, and an excellent   Fig. 1   Mass Spectrum of IgG Full-length  Mass range                  m/z 1 to 500,000
                     value for the price.                                        Sugar unit
                     The following describes an example of profiling IgG glycan        25363.9                                           Mass resolution              >5,000 FWHM
                     modifications without releasing any glycans. Human IgG1K monoclonal                                                 Sensitivity                  >250 amol                                                              Characterization
                                                                                      25197.0
                     antibodies (NISTmAb), IgG from mouse serum, and myeloma IgG were   25548.2  Mouse myeloma
                     dissolved in a Tris-NaCl buffer solution and incubated together with   25552.8                                      Mass accuracy                <20 ppm with internal calibration, <150 ppm with external calibration
                     IdeZ (IgG-degrading enzyme) for two hours at 37 °C. Then Protein A                                                  Acceleration voltage         15 kV
                                                                                       25384.8
                     magnetic beads were used to recover Fc sections. The Fc regions were   Mouse serum
                                                                                         25907.1                                         Laser                        Solid-state laser wavelength: 355 nm   Repetition frequency: 50, 100, or 200 Hz (variable)
                     eluted from the beads with an acidic solution and desalted with ZipTip   100  25340.1
                     C18 tips. Sinapic and ferulic acids were respectively dissolved in a 50 %   % Intensity  80 60  25169.6 25512.0     Flight distance              850 mm
                     acetonitrile solution containing 0.1 % TFA to a final concentration of   40  25689.4  NIST mAb
                                                                           20            25862.9                                         Detector                     Electron Multiplier
                     20 mg/mL. Then the resulting solutions were used as matrices for MS   0  23000  24000  25000  m/z  26000  27000  28000
                     analysis.                                                                                                           Ion source cleaning          Includes automatic cleaning functionality (depending on built-in solid-state laser)
                                                                                Fig. 2   Mass Spectrum of Fc Region                                                                                                                          Quality Control
                                                                                                                                         Sample plate                 Disposable FlexiMass-DS and stainless steel FlexiMass-SR
                                      Mouse myeloma  NIST mAb  Mouse serum                                                               Operating noise              <55 dB
                                                        A data set of            NIST mAb
                                                        various Fc                                                                       Main unit power supply       Single-phase 100 to 240 V AC, 50/60 Hz, 1 kVA
                                                                                                                                         Dimensions                   W 600 mm × D 745 mm × H 1,055 mm (excluding protrusions)
                                                                                   Mouse serum
                                     Save peak lists                                                                                     Weight                       86 kg
                                     in each folder                        Mouse myeloma
                                                        Open “IgG” folder                                                                Operating environment        Temperature: 18 to 28 °C     Humidity: Max. 70 % (with no condensation)
                                                        in eMSTAT Solution
                                                                                                                                         Data analysis software       eMSTAT Solution
                                                                                                                                         Data analysis   Univariate analysis  t-Test, Mann-Whitney U-Test, ANOVA (analysis of variance)      Pharmacokinetics
                                                                      Generation of Score Plot in a minute                               functionality
                                                                                                                                                        Multivariate analysis  PCA (principal component analysis), PLS-DA
                                                     Fig. 3   Classification of Fc Region Using eMSTAT Solution
                                                                                                                                                        Discriminant analysis Support Vector Machine (SVM), Random Forest
                     Conclusion                                    Application Examples                                                                 Other         Dynamic grouping
                                                                                                                                         Display functionality  Multivariate analysis  Peak Matrix, Box Plot, ROC, AUC, Score/Loading Plot, Dendrogram
                     The MALDI-8020 provides ample MS resolution for recognizing three   • Quality control of antibody drugs
                     Fc regions with different varieties of glycan modifications. In addition,   • Synthesis confirmation of nucleic acid drugs         Discriminant analysis Discriminant analysis results (Group, Score) superimpose points for unknown samples on a score plot  Others
                     statistical analysis using eMSTAT Solution enabled quick classification of                                          Input/output data  Input     Peak list (ASCII, JCAMP, or mzML format)
                     the three Fc types, which could be used for batch analysis, QA/QC, or
                     other applications.                                                                                                                Output        Peak list (txt format), data analysis results (xlsm format), graph screenshot


        32                                                                                                                                                                                                                                  33
                                                                                                            index                                                                                                                  index
   27   28   29   30   31   32   33   34   35   36   37