Page 36 - Pharmaceutical- Guide to Biopharmaceutical
P. 36

Characterization                Quality Control


                     Characterization of Monoclonal Antibodies                                                                          LCMS-9030


                                 Molecular Weight Analysis of Monoclonal Antibodies Using                                                                  benefits

                               the LCMS-9030 Quadrupole Time-of-Flight Mass Spectrometer                                                                                                                                                     Cell Line Optimization
                                                                                                 click here                                     •  Trace quantities of impurities contained in pharmaceutical ingredients can be
                                                                                                                                                  measured with high sensitivity.
                     Operating Principle and Features              Results
                                                                                                                                                • Accurate mass information can be used to identify impurities in products.
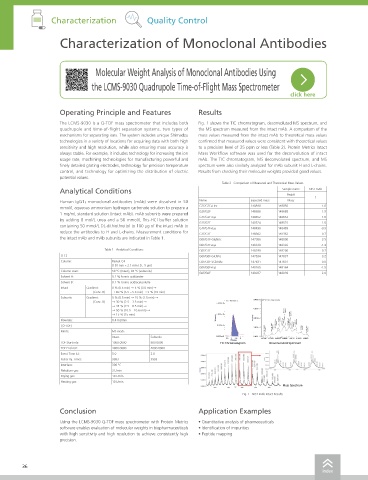
                     The LCMS-9030 is a Q-TOF mass spectrometer that includes both   Fig. 1 shows the TIC chromatogram, deconvoluted MS spectrum, and   • Deconvoluted spectra can be used to check the molecular weights in antibody drugs.
                     quadrupole and time-of-flight separation systems, two types of   the MS spectrum measured from the intact mAb. A comparison of the
                     mechanisms for separating ions. The system includes unique Shimadzu   mass values measured from the intact mAb to theoretical mass values                                                                               Culture
                     technologies in a variety of locations for acquiring data with both high   confirmed that measured values were consistent with theoretical values
                     sensitivity and high resolution, while also ensuring mass accuracy is   to a precision level of 25 ppm or less (Table 2). Protein Metrics Intact
                     always stable. For example, it includes technology for increasing the ion   Mass Workflow software was used for the deconvolution of intact
                     usage rate, machining technologies for manufacturing powerful and   mAb. The TIC chromatogram, MS deconvoluted spectrum, and MS
                     finely detailed grating electrodes, technology for precision temperature   spectrum were also similarly analyzed for mAb subunit H and L-chains.
                     control, and technology for optimizing the distribution of electric   Results from checking their molecular weights provided good values.
                     potential values.
                                                                           Table 2   Comparison of Measured and Theoretical Mass Values
                     Analytical Conditions                                                    Sample name  NIST mAb
                                                                                                Peak#
                                                                                                         1                                                                                                                                   Purification
                     Human IgG1K monoclonal antibodies (mAb) were dissolved in 50   Name  Expected mass  Mass
                     mmol/L aqueous ammonium hydrogen carbonate solution to prepare a   G2F/G2F+Hex  148848  148850  1.8
                     1 mg/mL standard solution (intact mAb). mAb subunits were prepared   G2F/G2F  148686  148688  1.9
                                                                                    148652
                                                                                             148653
                                                                   G1F/G2F+Lys
                                                                                                            1.6
                     by adding 8 mol/L urea and a 50 mmol/L Tris-HCl buffer solution   G1F/G2F  148524  148525  1.0
                     containing 50 mmol/L DL-dithiothreitol to 100 μg of the intact mAb to   G1F/G1F+Lys  148490  148489  -0.9
                     reduce the antibodies to H and L-chains. Measurement conditions for   G1F/G1F  148362  148362  0.7
                     the intact mAb and mAb subunits are indicated in Table 1.  G0F/G1F-GluNAc  147996  148000  3.5
                                                                   G0F/G1F+Lys      148328   148326        -1.4
                                    Table 1   Analytical Conditions  G0F/G1F        148199   148200         0.7
                      [LC]                                         G0F/G0F-GlcNAc   147834   147837         3.2
                     Column:          Restek C4                    G0F/G0F-2GlcNAc  147631   147631         0.0                                                                                                                              Characterization
                                      (150 mm × 2.1 mm I.D., 5 µm)
                                                                   G0F/G0F+Lys      148165   148164        -1.5                         Specifications
                     Column oven:     50 °C (Intact), 85 °C (subunits)
                                                                   G0F/G0F          148037   148039         2.0
                     Solvent A:       0.1 % formic acid/water
                                                                                                                                         Instrument                        LCMS-9030
                     Solvent B:       0.1 % formic acid/acetonitrile
                     Intact         Gradient:  0 % (0.5 min) → 5 % (3.0 min) →                                                           Mass range                        Quadrupole mass range:  m/z 10 to 2,000
                                      (Conc. B)  → 60 % (5.5 – 5.6 min) → 5 % (10 min)
                     Subunits         Gradient:  0 % (0.5 min) → 15 % (1.5 min) →                                                                                          TOF mass range:   m/z 10 to 40,000
                                      (Conc. B)  → 30 % (2.5 – 3.5 min) →
                                      → 45 % (7.5 – 8.5 min) →                                                                           Sensitivity      ESI positive     1 pg reserpine
                                      → 50 % (10.5 – 10.6 min) →
                                      → 15 % (15 min)                                                                                                                      S/N > 1,000:1 (RMS) in MS mode
                     Flowrate:        0.4 mL/min                                                                                                                           S/N > 10,000:1 (RMS) in MS/MS mode                                Quality Control
                      [Q-TOF]
                                                                                                                                                          ESI negative     1 pg chloramphenicol
                     Mode:            MS mode
                                      Intact       Subunits                                                                                                                S/N > 1,000:1 (RMS) in MS mode
                     TOF Start m/z:   1000.0000    800.0000               TIC Chromatogram  Deconvoluted Spectrum
                     TOF End m/z:     4000.0000    4000.0000                                                                                                               S/N > 10,000:1 (RMS) in MS/MS mode
                     Event Time (s):  5.0          2.0                                                                                   Resolution (Quadrupole)           R < 0.8 u FWHM
                     Pulser Inj. Times:  9993      3993
                     Interface:       300 °C                                                                                             Resolution (TOF)  ESI positive    30,000 FWHM at m/z 1,972
                     Nebulizer gas:   3 L/min
                                                                                                                                                          ESI negative     30,000 FWHM at m/z 1,626
                     Drying gas:      10 L/min
                     Heating gas:     10 L/min                                                                                           Mass accuracy    MS mode          < 1 ppm (peak to peak) at m/z 622.5662,                           Pharmacokinetics
                                                                                               Mass Spectrum                                                               NaI cluster (internal calibration)
                                                                                 Fig. 1   NIST mAb Intact Results                                         MS/MS mode       < 2 ppm (peak to peak) at m/z 1072.2489 > 472.6719
                                                                                                                                                                           NaI cluster (external calibration)
                     Conclusion                                    Application Examples                                                  Mass accuracy temperature stability  1 ppm/24 h, 18 to 28 °C at constant temperature
                                                                                                                                         Maximum acquisition rate          100 Hz
                     Using the LCMS-9030 Q-TOF mass spectrometer with Protein Metrics   • Quantitative analysis of pharmaceuticals       Polarity switching time           1 sec                                                             Others
                     software enables evaluation of molecular weights in biopharmaceuticals   • Identification of impurities
                     with high sensitivity and high resolution to achieve consistently high   • Peptide mapping                          Interface                         Standard:  ESI
                     precision.                                                                                                                                            Optional:  APCI, DUIS, CDS, Nano-ESI

        36                                                                                                                                                                                                                                  37
                                                                                                            index                                                                                                                  index
   31   32   33   34   35   36   37   38   39   40   41