Page 69 - Pharmaceutical Solution for Pharma Analysis
P. 69

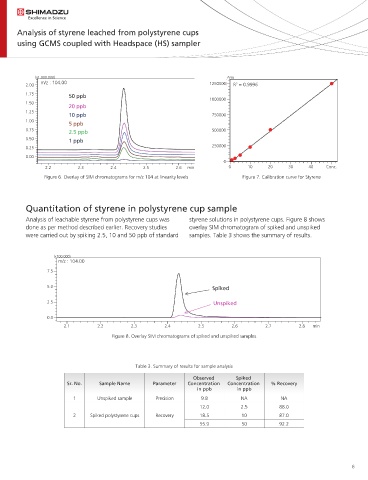
Analysis of styrene leached from polystyrene cups
       using GCMS coupled with Headspace (HS) sampler


             (x1,000,000)                                                   Area
              m/z : 104.00                                            1250000
                                                                               2
          2.00                                                                R  = 0.9996
          1.75          50 ppb
          1.50                                                        1000000
                        20 ppb
          1.25
                        10 ppb                                         750000
          1.00
                        5 ppb
          0.75          2.5 ppb                                        500000
          0.50          1 ppb
          0.25                                                         250000
          0.00
                                                                           0
                2.2        2.3        2.4       2.5        2.6  min          0     10     20     30    40    Conc.
                Figure 6. Overlay of SIM chromatograms for m/z 104 at linearity levels  Figure 7. Calibration curve for Styrene


          Quantitation of styrene in polystyrene cup sample

          Analysis of leachable styrene from polystyrene cups was   styrene solutions in polystyrene cups. Figure 8 shows
          done as per method described earlier. Recovery studies   overlay SIM chromatogram of spiked and unspiked
          were carried out by spiking 2.5, 10 and 50 ppb of standard   samples. Table 3 shows the summary of results.


                   (x100,000)
                    m/z : 104.00

                 7.5

                 5.0                                                   Spiked

                 2.5                                                    Unspiked

                 0.0
                      2.1        2.2        2.3         2.4        2.5        2.6        2.7        2.8  min
                                      Figure 8. Overlay SIM chromatograms of spiked and unspiked samples


                                              Table 3. Summary of results for sample analysis

                                                                 Observed      Spiked
                       Sr. No.    Sample Name       Parameter  Concentration   Concentration   % Recovery
                                                                  in ppb        in ppb
                         1       Unspiked sample     Precision      9.8          NA           NA
                                                                   12.0          2.5          88.0
                         2     Spiked polystyrene cups  Recovery   18.5          10           87.0
                                                                   55.9          50           92.2


                                                                                                                      6
   64   65   66   67   68   69   70   71   72   73   74