
Page 17 - Shimadzu’s Solutions for Impurities Analysis
P. 17
FDA Regulations on
Inorganic Impurities
ICP Emission Spectrometer
Data
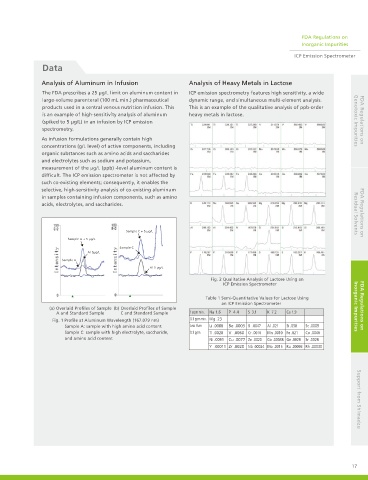
Analysis of Aluminum in Infusion Analysis of Heavy Metals in Lactose
The FDA prescribes a 25 μg/L limit on aluminum content in ICP emission spectrometry features high sensitivity, a wide
large-volume parenteral (100 mL min.) pharmaceutical dynamic range, and simultaneous multi-element analysis.
products used in a central venous nutrition infusion. This This is an example of the qualitative analysis of ppb-order
is an example of high-sensitivity analysis of aluminum heavy metals in lactose.
(spiked to 5 μg/L) in an infusion by ICP emission Genotoxic Impurities FDA Regulations on
spectrometry.
As infusion formulations generally contain high
concentrations (g/L level) of active components, including
organic substances such as amino acids and saccharides
and electrolytes such as sodium and potassium,
measurement of the μg/L (ppb) -level aluminum content is
difficult. The ICP emission spectrometer is not affected by
such co-existing elements; consequently, it enables the
selective, high-sensitivity analysis of co-existing aluminum
in samples containing infusion components, such as amino
acids, electrolytes, and saccharides. Residual Solvents FDA Regulations on
Sample C + 5 μg/L
Sample A + 5 μg/L
Sample C
Al 5μg/L
Sample A
Al 5 μg/L
Fig. 2 Qualitative Analysis of Lactose Using an
ICP Emission Spectrometer
Table 1 Semi-Quantitative Values for Lactose Using
an ICP Emission Spectrometer
(a) Overlaid Profiles of Sample (b) Overlaid Profiles of Sample Inorganic Impurities FDA Regulations on
A and Standard Sample C and Standard Sample 1 ppm min. Na 1.6 P 4.4 S 3.1 K 7.2 Ca 1.9
Fig. 1 Profile at Aluminum Wavelength (167.079 nm) 0.1 ppm min. Mg .23
Sample A: sample with high amino acid content Less than Li .0088 Be .0003 B .0047 Al .021 Si .058 Sc .0009
Sample C: sample with high electrolyte, saccharide, 0.1 ppm Ti .0020 V .0060 Cr .0016 Mn .0010 Fe .021 Co .0046
and amino acid content Ni .0091 Cu .0077 Zn .0020 Ga .00038 Ge .0028 Sr .0028
Y .00011 Zr .0020 Nb .00024 Mo .0015 Ru .00096 Rh .00030 Support from Shimadzu
17