Page 11 - Shimadzu’s Solutions for Impurities Analysis
P. 11

FDA Regulations on
                                                                                                     Genotoxic Impurities
                                                                                                        LCMS-2020
               Data


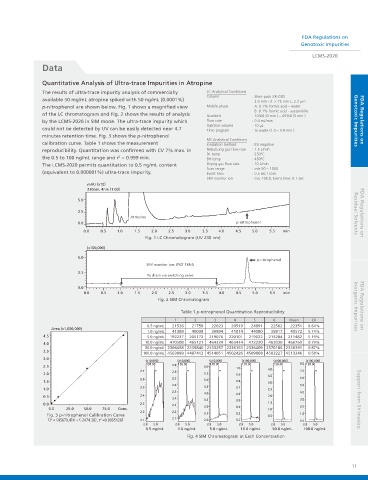
               Quantitative Analysis of Ultra-trace Impurities in Atropine
               The results of ultra-trace impurity analysis of commercially   LC Analytical Conditions
                                                                      Column         : Shim-pack XR-ODS
               available 50 mg/mL atropine spiked with 50 ng/mL (0.0001%)
                                                                                       2.0 mm i.d. × 75 mm L, 2.2 μm
               p-nitrophenol are shown below. Fig. 1 shows a magnified view   Mobile phase  : A: 0.1% formic acid – water
                                                                                       B: 0.1% formic acid - acetonitrile
               of the LC chromatogram and Fig. 2 shows the results of analysis   Gradient  : 10%B (0 min ) – 45%B (5 min )
               by the LCMS-2020 in SIM mode. The ultra-trace impurity which   Flow rate  : 0.4 mL/min                 Genotoxic Impurities  FDA Regulations on
                                                                      Injection volume  : 10 μL
               could not be detected by UV can be easily detected near 4.7   Time program  : to waste (1.0 – 3.8 min )
               minutes retention time. Fig. 3 shows the p-nitrophenol
                                                                      MS Analytical Conditions
               calibration curve. Table 1 shows the measurement       Ionization method  : ESI negative
               reproducibility. Quantitation was confirmed with CV 7% max. in   Nebulizing gas flow rate  : 1.5 L/min
                                                                      DL temp        : 250ºC
               the 0.5 to 100 ng/mL range and r  = 0.999 min.         BH temp        : 450ºC
                                        2
               The LCMS-2020 permits quantitation to 0.5 ng/mL content   Drying gas flow rate  : 10 L/min
                                                                      Scan range     : m/z 50 – 1000
               (equivalent to 0.000001%) ultra-trace impurity.        Event time     : 0.5 sec / scan
                                                                      SIM monitor ion  : m/z 138.0, Event time: 0.1 sec
                              mAU (x10)
                              230nm, 4nm (1.00)
                           5.0
                           2.5                                                                                        Residual Solvents  FDA Regulations on
                                            Atropine
                           0.0                                                 p-nitrophenol
                             0.0  0.5   1.0   1.5  2.0   2.5  3.0   3.5  4.0   4.5   5.0  5.5  min
                                                 Fig. 1 LC Chromatogram (UV 230 nm)
                              (x100,000)
                           5.0
                                                                                      p-nitrophenol
                                                  SIM monitor ion: m/z 138.0
                           2.5
                                                  To drain via switching valve
                           0.0
                             0.0  0.5   1.0   1.5  2.0   2.5  3.0   3.5   4.0  4.5   5.0  5.5  min
                                                     Fig. 2 SIM Chromatogram
                                                             Table 1 p-nitrophenol Quantitation Reproducibility       Inorganic Impurities  FDA Regulations on
                                                           1     2      3      4     5      6    Mean   CV
                                                  0.5 ng/mL  21536  21759  22023  20519  24891  22562  22351  6.64%
                  Area (x1,000,000)
                                                  1.0 ng/mL  41389  40039  39994  41014  44080  36917  40572  5.74%
               4.5                                5.0 ng/mL  192237  205172  219076  220101  219022  213284  211482  5.19%
                                                 10.0 ng/mL  470508  465121  464324  465414  472220  463030  466769  0.79%
               4.0
                                                 50.0 ng/mL 2306458 2335840 2333257 2336193 2336409 2370186 2336391  0.87%
               3.5
                                                100.0 ng/mL 4563089 4487412 4514051 4502426 4509868 4503227 4513346  0.58%
               3.0
                                                 (x10,000)  (x10,000)  (x10,000)  (x100,000)  (x100,000)  (x100,000)
                                                 138.00     138.00     138.00    138.00     138.00  8.0 138.00
               2.5                                        2.9        6.0
                                                                               1.0        4.0
                                               2.7        2.8                                       7.0
               2.0                                                   5.5       0.9        3.5
                                               2.6        2.7        5.0                            6.0
               1.5                                                             0.8        3.0
                                                          2.6                                       5.0
                                               2.5                   4.5       0.7
               1.0                                                                        2.5
                                                          2.5        4.0       0.6                  4.0
               0.5                             2.4                                        2.0
                                                          2.4                                       3.0
                                                                     3.5       0.5                                     Support from Shimadzu
               0.0                             2.3        2.3                             1.5
                 0.0   25.0  50.0  75.0  Conc.                       3.0       0.4        1.0       2.0
                                               2.2        2.2        2.5       0.3
                 Fig. 3 p-nitrophenol Calibration Curve                                   0.5       1.0
                 (Y = (45679.4)X + (-2474.38), r  =0.9995126)  2.1  2.1  2.0   0.2                  0.0
                                  2
                                                2.8  5.0   2.8  5.0   2.8  5.0  2.8  5.0   2.8  5.0  2.8  5.0
                                                 0.5 ng/mL  1.0 ng/mL  5.0 ng/mL  10.0 ng/mL  50.0 ng/mL  100.0 ng/mL
                                                               Fig. 4 SIM Chromatogram at Each Concentration
                                                                                                                      11
   6   7   8   9   10   11   12   13   14   15   16