Page 9 - Shimadzu’s Solutions for Impurities Analysis
P. 9

Analysis of Ultra-Trace Impurities
                                                                                                   Co-Sense for LC/MS System
                                                                                                     2D-LC/LCMS-IT-TOF ®
               Data


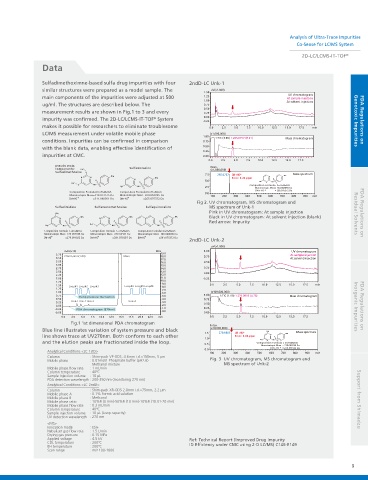
               Sulfadimethoximne-based sulfa drug impurities with four   2ndD-LC Unk-1
               similar structures were prepared as a model sample. The   uV(x1,000)
                                                                     1.50
                                                                                                UV chromatogram
               main components of the impurities were adjusted at 500   1.25                    At sample injection
                                                                     1.00                       At solvent injection
               ug/ml. The structures are described below. The        0.75
                                                                     0.50
               measurement results are shown in Fig.1 to 3 and every   0.25
                                                    ®
               impurity was confirmed. The 2D-LC/LCMS-IT-TOF  System   0.00                                             FDA Regulations on
                                                                    -0.25                                             Genotoxic Impurities
               makes it possible for researchers to eliminate troublesome   0.0  2.5  5.0  7.5  10.0  12.5  15.0  17.5  min
               LC/MS measurement under volatile mobile phase           (x1,000,000)
                                                                    1.00  1:TIC (1.00) 1:265.0757 (8.21)  Mass chromatogram
               conditions. Impurities can be confirmed in comparison   0.75
                                                                    0.50
               with the blank data, enabling effective identification of
                                                                    0.25
               impurities at CMC.                                   0.00
                                                                      0.0  2.5  5.0  7.5  10.0  12.5  15.0  17.5
                   pseudo main                                         Inten.
                   components:  H 3C        Sulfamerazine              (x1,000,000)
                   Sulfadimethoxine  O
                                                                     7.5  265.0757  [M+H] +       Mass spectrum
                                      NH 2                                                     1+
                            N  N                    NH 2                      Error: 1.24 ppm  1
                                             N                                             2
                                 O                                   5.0                    6 6
                                               O                                       + & &  1  1+
                         H 3C    S                                                          2
                           O    NH              S                                   Composition Formula= C11H12N4O2S
                                  O      H 3C  N  NH                 2.5
                                                 O                                   Monoisotopic Mass   = 264.068096 Da
                                                                                     [ M + H ]  +                  = 265.075372 Da
                        Composition Formula=C12H14N4O4S  Composition Formula=C11H12N4O2S  0.0
                        Monoisotopic Mass=310.073575 Da  Monoisotopic Mass=264.068096 Da  100  200  300  400  500  600  700  800  900  m/z
                        [M+H] +                 =311.080851 Da  [M+H] +                  =265.075372 Da
                                                                  Fig 2. UV chromatogram, MS chromatogram and
                   Sulfadimidine  Sulfamonomethoxine  Sulfaquinoxaline            MS spectrum of Unk-1
                                                                      Pink in UV chromatogram: At sample injection
                   CH 3                                                                                               Residual Solvents  FDA Regulations on
                                                   N
                            NH 2            NH 2           NH 2       Black in UV chromatogram: At solvent injection (blank)
                     N            N  N
                       O               O              O               Red arrow: Impurity
                H 3C  N  NH  S  H 3C  O  NH  S     N  NH  S
                        O               O              O
                Composition Formula=C12H14N4O2S  Composition Formula=C11H12N4O3S  Composition Formula=C14H12N4O2S
                Monoisotopic Mass=278.083746 Da  Monoisotopic Mass=280.06301 Da  Monoisotopic Mass=300.068096 Da
                  +                   +                  =281.070287 Da
                [M+H]  =279.091022 Da  [M+H]   [M+H] +                  =301.075372 Da
                                                                2ndD-LC Unk-2
                                                                       uV(x1,000)
                      mAU(x10)                       MPa             1.00                         UV chromatogram
                    3.75                              19.0                                       At sample injection
                      270nm,4nm(1.00)     Main        18.0           0.75
                    3.50                                                                         At solvent injection
                                                      17.0
                    3.25                              16.0           0.50
                    3.00                              15.0
                    2.75                              14.0           0.25
                    2.50                              13.0           0.00
                    2.25                              12.0
                    2.00                              11.0          -0.25
                    1.75                              10.0
                                                       9.0
                    1.50                  Loop#4 Loop#5  Loop#6        0.0  2.5  5.0  7.5  10.0  12.5  15.0  17.5  min
                        Loop#1 Loop#2  Loop#3          8.0
                    1.25                               7.0
                    1.00                                               (x100,000,000)
                                                       6.0
                    0.75                               5.0           1.00  1:TIC (1.00) 1:279.0905 (4.76)  Mass chromatogram
                           Pump pressure fluctuation
                    0.50                               4.0           0.75
                    0.25  Unk-1 Unk-2 Unk-3  Unk-4     3.0           0.50
                    0.00                               2.0                                                            Inorganic Impurities  FDA Regulations on
                                                       1.0           0.25
                   -0.25  PDA chromatogram (270nm)
                   -0.50                               0.0           0.00
                     0.0  2.5  5.0  7.5  10.0  12.5  15.5  17.5  20.0  22.5  min  0.0  2.5  5.0  7.5  10.0  12.5  15.0  17.5
                        Fig.1 1st dimensional PDA chromatogram
                                                                       Inten.
               Blue line illustrates variation of system pressure and black   (x10,000,000)  &+
                                                                     1.5  279.0905  [M+H] +     1+   Mass spectrum
               line shows trace at UV270nm. Both conform to each other         Error: 1.88 ppm  1  2
                                                                     1.0               + &  1  1+  6
               and the elution peaks are fractionated inside the loop.                Composition Formula  = C12H14N4O2S
                                                                                             2
                                                                     0.5
                                                                                             Monoisotopic Mass  = 278.083746 Da
                                                                                                           [ M + H ]  +   = 279.091022 Da
                                                                     0.0
                 Analytical Conditions <LC 1stD>
                                                                      100  200  300  400  500  600  700  800  900  m/z
                 Column        : Shim-pack VP-ODS, 4.6mm i.d.×150mm, 5 μm
                 Mobile phase  : 0.01mol/L Phosphate buffer (pH2.6)    Fig. 3  UV chromatogram, MS chromatogram and
                                 Methanol mixture                                 MS spectrum of Unk-2
                 Mobile phase flow rate  : 1 mL/min
                 Column temperature  : 40ºC
                 Sample injection volume  : 10 μL
                 PDA detection wavelength : 200-350 nm (monitoring 270 nm)
                 Analytical Conditions <LC 2ndD>
                 Column        : Shim-pack XR-ODS 2.0mm i.d.×75mm, 2.2 μm
                 Mobile phase A  : 0.1% Formic acid solution
                 Mobile phase B      : Methanol
                 Mobile phase ratio  : 10%B (0 min)-50%B (10 min)-10%B (10.01-20 min)                                  Support from Shimadzu
                 Mobile phase flow rate  : 0.3 mL/min
                 Column temperature  : 40ºC
                 Sample injection volume  : 10 μL (Loop capacity)
                 UV detection wavelength  : 270 nm
                 <MS>
                 Ionization mode  : ESI+
                 Nebulizer gas flow rate  : 1.5 L/min
                 Drying gas pressure  : 0.15 MPa
                 Applied voltage  : 4.5 kV                      Ref: Technical Report (Improved Drug Impurity
                 CDL temperature  : 200ºC
                 BH temperature  : 200ºC                        ID Efficiency under CMC using 2-D LC/MS) C146-E149
                 Scan range    : m/z 100-1000
                                                                                                                      9
   4   5   6   7   8   9   10   11   12   13   14