
Page 14 - Shimadzu Journal vol.3 Issue2
P. 14
Metabolomics
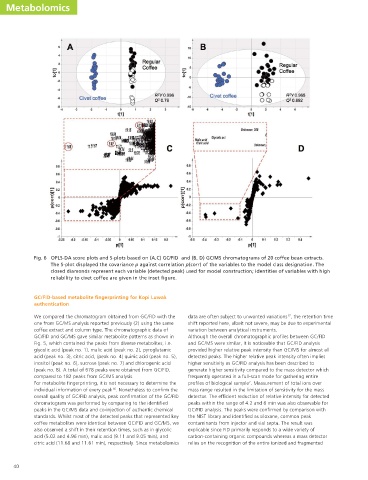
Fig. 6 OPLS-DA score plots and S-plots based on (A,C) GC/FID and (B, D) GC/MS chromatograms of 20 coffee bean extracts.
The S-plot displayed the covariance p against correlation p(corr) of the variables to the model class designation. The
closed diamonds represent each variable (detected peak) used for model construction; identities of variables with high
reliability to civet coffee are given in the inset figure.
GC/FID-based metabolite fingerprinting for Kopi Luwak
authentication
We compared the chromatogram obtained from GC/FID with the data are often subject to unwanted variations , the retention time
17
one from GC/MS analysis reported previously (2) using the same shift reported here, albeit not severe, may be due to experimental
coffee extract and column type. The chromatographic data of variation between analytical instruments.
GC/FID and GC/MS gave similar metabolite patterns as shown in Although the overall chromatographic profiles between GC/FID
Fig. 5, which contained the peaks from diverse metabolites, i.e. and GC/MS were similar, it is noticeable that GC/FID analysis
glycolic acid (peak no. 1), malic acid (peak no. 2), pyroglutamic provided higher relative peak intensity than GC/MS for almost all
acid (peak no. 3), citric acid, (peak no. 4) quinic acid (peak no. 5), detected peaks. The higher relative peak intensity often implies
inositol (peak no. 6), sucrose (peak no. 7) and chlorogenic acid higher sensitivity as GC/FID analysis has been described to
(peak no. 8). A total of 678 peaks were obtained from GC/FID, generate higher sensitivity compared to the mass detector which
compared to 182 peaks from GC/MS analysis. frequently operated in a full-scan mode for gathering entire
2
For metabolite fingerprinting, it is not necessary to determine the profiles of biological sample . Measurement of total ions over
16
individual information of every peak . Nonetheless to confirm the mass range resulted in the limitation of sensitivity for the mass
overall quality of GC/FID analysis, peak confirmation of the GC/FID detector. The efficient reduction of relative intensity for detected
chromatogram was performed by comparing to the identified peaks within the range of 4.2 and 6 min was also observable for
peaks in the GC/MS data and co-injection of authentic chemical GC/FID analysis. The peaks were confirmed by comparison with
standards. Whilst most of the detected peaks that represented key the NIST library and identified as siloxane, common peak
coffee metabolites were identical between GC/FID and GC/MS, we contaminants from injector and vial septa. The result was
also observed a shift in their retention times, such as in glycolic explicable since FID primarily responds to a wide variety of
acid (5.02 and 4.96 min), malic acid (9.11 and 9.05 min), and carbon-containing organic compounds whereas a mass detector
citric acid (11.68 and 11.61 min), respectively. Since metabolomics relies on the recognition of the entire ionized and fragmented
40