
Page 17 - Shimadzu Journal vol.3 Issue2
P. 17
Flavor Release Evaluation
Results and discussion
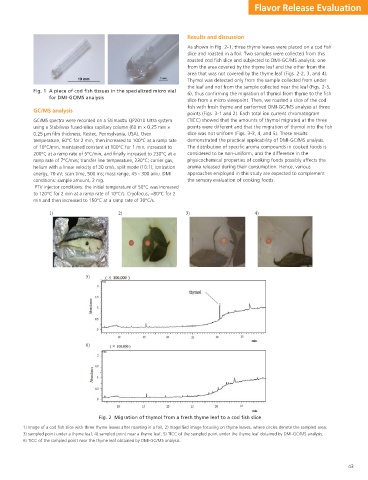
As shown in Fig. 2-1, three thyme leaves were placed on a cod fish
slice and roasted in a foil. Two samples were collected from this
roasted cod fish slice and subjected to DMI-GC/MS analysis: one
from the area covered by the thyme leaf and the other from the
area that was not covered by the thyme leaf (Figs. 2-2, 3, and 4).
Thymol was detected only from the sample collected from under
the leaf and not from the sample collected near the leaf (Figs. 2-5,
Fig. 1 A piece of cod fish tissues in the specialized micro vial
6), thus confirming the migration of thymol from thyme to the fish
for DMI-GC/MS analysis
slice from a micro viewpoint. Then, we roasted a slice of the cod
fish with fresh thyme and performed DMI-GC/MS analysis at three
GC/MS analysis
points (Figs. 3-1 and 2). Each total ion current chromatogram
GC/MS spectra were recorded on a Shimadzu QP2010 Ultra system (TICC) showed that the amounts of thymol migrated at the three
using a Stabilwax fused-silica capillary column (60 m × 0.25 mm × points were different and that the migration of thymol into the fish
0.25 µm film thickness; Restec, Pennsylvania, USA). Oven slice was not uniform (Figs. 3-3, 4, and 5). These results
temperature, 60°C for 2 min, then increased to 100°C at a ramp rate demonstrated the practical applicability of DMI-GC/MS analysis.
of 10°C/min, maintained constant at 100°C for 1 min, increased to The distribution of specific aroma compounds in cooked foods is
200°C at a ramp rate of 5°C/min, and finally increased to 230°C at a considered to be non-uniform, and the difference in the
ramp rate of 7°C/min; transfer line temperature, 230°C; carrier gas, physicochemical properties of cooking foods possibly affects the
helium with a linear velocity of 30 cm/s; split mode (10:1); ionization aroma released during their consumption. Hence, various
energy, 70 eV; scan time, 500 ms; mass range, 45 - 300 amu. DMI approaches employed in this study are expected to complement
conditions: sample amount, 2 mg. the sensory evaluation of cooking foods.
PTV injector conditions: the initial temperature of 50°C was increased
to 120°C for 2 min at a ramp rate of 10°C/s. Cryofocus, −80°C for 2
min and then increased to 150°C at a ramp rate of 30°C/s.
1) 2) 3) 4)
5)
6)
Fig. 2 Migration of thymol from a fresh thyme leaf to a cod fish slice
1) Image of a cod fish slice with three thyme leaves after roasting in a foil; 2) magnified image focusing on thyme leaves, where circles denote the sampled area;
3) sampled point under a thyme leaf; 4) sampled point near a thyme leaf; 5) TICC of the sampled point under the thyme leaf obtained by DMI-GC/MS analysis;
6) TICC of the sampled point near the thyme leaf obtained by DMI-GC/MS analysis.
43