
Page 12 - Shimadzu Journal vol.3 Issue2
P. 12
Metabolomics
citric acid, glycolic acid, and malic acid, identified from OPLS-DA, and differentiation. Similar to prior strategy, separation of those four
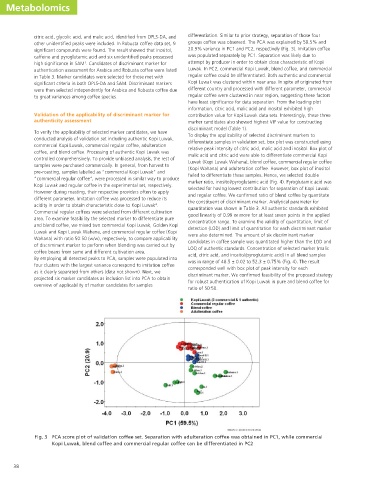
other unidentified peaks were included. In Robusta coffee data set, 9 groups coffee was observed. The PCA was explained by 59.5% and
significant compounds were found. The result showed that inositol, 20.9% variance in PC1 and PC2, respectively (Fig. 3). Imitation coffee
caffeine and pyroglutamic acid and six unidentified peaks possessed was populated separately by PC1. Separation was likely due to
1
high significance in SAM . Candidates of discriminant marker for attempt by producer in order to obtain close characteristic of Kopi
authentication assessment for Arabica and Robusta coffee were listed Luwak. In PC2, commercial Kopi Luwak, blend coffee, and commercial
in Table 3. Marker candidates were selected for those met with regular coffee could be differentiated. Both authentic and commercial
significant criteria in both OPLS-DA and SAM. Discriminant markers Kopi Luwak was clustered within near area. In spite of originated from
were then selected independently for Arabica and Robusta coffee due different country and processed with different parameter, commercial
to great variances among coffee species. regular coffee were clustered in near region, suggesting these factors
have least significance for data separation. From the loading plot
information, citric acid, malic acid and inositol exhibited high
Validation of the applicability of discriminant marker for contribution value for Kopi Luwak data sets. Interestingly, these three
authenticity assessment marker candidates also showed highest VIP value for constructing
discriminant model (Table 1).
To verify the applicability of selected marker candidates, we have
To display the applicability of selected discriminant markers to
conducted analysis of validation set including authentic Kopi Luwak,
differentiate samples in validation set, box plot was constructed using
commercial Kopi Luwak, commercial regular coffee, adulteration
relative peak intensity of citric acid, malic acid and inositol. Box plot of
coffee, and blend coffee. Processing of authentic Kopi Luwak was
malic acid and citric acid were able to differentiate commercial Kopi
controlled comprehensively. To provide unbiased analysis, the rest of
Luwak (Kopi Luwak Wahana), blend coffee, commercial regular coffee
samples were purchased commercially. In general, from harvest to
(Kopi Wahana) and adulteration coffee. However, box plot of inositol
pre-roasting, samples labelled as “commercial Kopi Luwak” and
failed to differentiate these samples. Hence, we selected double
“commercial regular coffee”, were processed in similar way to produce
marker ratio, inositol/pyroglutamic acid (Fig. 4). Pyroglutamic acid was
Kopi Luwak and regular coffee in the experimental set, respectively.
selected for having lowest contribution for separation of Kopi Luwak
However during roasting, their respective providers often to apply
and regular coffee. We confirmed ratio of blend coffee by quantitate
different parameter. Imitation coffee was processed to reduce its
the constituent of discriminant marker. Analytical parameter for
4
acidity in order to obtain characteristic close to Kopi Luwak .
quantitation was shown in Table 3. All authentic standards exhibited
Commercial regular coffees were selected from different cultivation
good linearity of 0.99 or more for at least seven points in the applied
area. To examine feasibility the selected marker to differentiate pure
concentration range. To examine the validity of quantitation, limit of
and blend coffee, we mixed two commercial Kopi Luwak, Golden Kopi
detection (LOD) and limit of quantitation for each discriminant marker
Luwak and Kopi Luwak Wahana, and commercial regular coffee (Kopi
were also determined. The amount of six discriminant marker
Wahana) with ratio 50:50 (w/w), respectively, to compare applicability
candidates in coffee sample was quantitated higher than the LOD and
of discriminant marker to perform when blending was carried out by
LOQ of authentic standards. Concentration of selected marker (malic
coffee beans from same and different cultivation area.
acid, citric acid, and inositol/pyroglutamic acid) in all blend samples
By employing all detected peaks to PCA, samples were populated into
was in range of 48.5 ± 0.02 to 52.3 ± 0.75% (Fig. 4). The result
four clusters with the largest variance correspond to imitation coffee
corresponded well with box plot of peak intensity for each
as it clearly separated from others (data not shown). Next, we
discriminant marker. We confirmed feasibility of the proposed strategy
projected six marker candidates as inclusion list into PCA to obtain
for robust authentication of Kopi Luwak in pure and blend coffee for
overview of applicability of marker candidates for samples
ratio of 50:50.
Fig. 3 PCA score plot of validation coffee set. Separation with adulteration coffee was obtained in PC1, while commercial
Kopi Luwak, blend coffee and commercial regular coffee can be differentiated in PC2
38