
Page 11 - Shimadzu Journal vol.3 Issue2
P. 11
Metabolomics
research objectives. However, the conventional Q/MS can be operated having two or more classes, OPLS-DA is the most suitable analysis
13
only at slow scan rate . With the improvement of processor and platform to isolate and select differentiation marker. The analysis
high-speed data processing, newly developed GC-Q/MS provides provides visualization of the covariance and correlation between
14
increased sensitivity in high scan speed up to 10,000 u/sec . compounds and the constructed discrimination model. Compounds
Total of 182 peaks from 21 coffee bean samples were extracted using that are highly contribute to the model and their reliability may
freely available software, MetAlign. Twenty compounds were possess potentially biochemically interesting characteristic, thus it can
tentatively identified by comparison with in-house library (retention be selected as biomarker candidates . The S-plot featured in OPLS-DA
10
index) and NIST library (retention time) and six compounds were visualizes covariance (contribution or magnitude) and correlation
1
identified by co-injecting authentic standards. Tentatively identified (reliability) between metabolites and modelled clas . Potential
compounds consist of organic acids, sugars, amino acids, and other candidates of discriminant markers for authenticity assessment of Kopi
compounds. Compounds that have been reported previously in Luwak can be selected via S-plot by setting the cut off for covariance,
research of coffee bean, including chlorogenic acid, quinic acid, p[1], and correlation value, p[corr], > |0.2|. S-plot of coffee data sets
succinic acid, citric acid, and malic acid, caffeine, one of compounds was shown in Fig. 1 In addition to cut off value, compounds for
for bitter taste in coffee, and sucrose, the most abundant simple candidates of discriminant markers were selected by its VIP (variable
carbohydrates in coffee beans, were identified . 1 importance in projection) value. Large VIP (> 1) values are more
To explore an overview of all samples and to obtain general relevant for model construction.
information on sample variances, unsupervised multivariate analysis, OPLS-DA score plot of Arabica coffee data sets were shown in Fig.
PCA, was selected. In previous research, PCA score plot derived from 1A. Discrimination between Kopi Luwak and regular coffee was
2
21 coffee bean displayed differentiation of two data groups based on obtained. The model explained the goodness-of-fit parameter (R ) and
2
their species, Arabica and Robusta. Due to large variance between the predictability parameter (Q ), 0.965 and 0.892, respectively (0.936
Arabica and Robusta coffee, samples differentiation based on type of and 0.829 after cross validation). This model was considered good
coffee (Kopi Luwak and regular coffee) could not be observed. PCA based on the above criteria. Significant compounds for samples
score plot showed data separation based on type of coffee, in which separation were plotted at the top and bottom of S-plot. Interestingly,
Kopi Luwak (digested by animal) and regular coffee (not digested) can compounds uncorrelated with Kopi Luwak were quinic acid, caffeine
be clearly separated only when the analyses were carried out and caffeic acid. As for predictive compounds (component to correlate
independently for each coffee species originated from same cultivation with Kopi Luwak) in above cut-off value, consist of citric acid, malic
area (data not shown). acid and glycolic acid. OPLS-DA score plot of Robusta coffee data sets
(Fig. 1B) were explained by R and Q , 0.957 and 0.818, respectively
2
2
(0.957 and 0.833 after cross validation). Inositol and caffeine (p,
Discriminant analysis to select candidates of discriminant marker
p[corr] exceeded cut-off value), were selected as discriminant marker
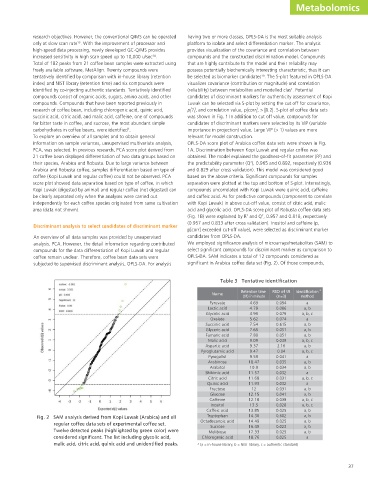
An overview of all data samples was provided by unsupervised candidates from OPLS-DA.
analysis, PCA. However, the detail information regarding contributed We employed significance analysis of microarrays/metabolites (SAM) to
compounds for the data differentiation of Kopi Luwak and regular select significant compounds for discriminant marker as comparison to
coffee remain unclear. Therefore, coffee bean data sets were OPLS-DA. SAM indicates a total of 12 compounds considered as
subjected to supervised discriminant analysis, OPLS-DA. For analysis significant in Arabica coffee data set (Fig. 2). Of those compounds,
Table 3 Tentative identification
Retention time RSD of tR Identification a
Name
(tR) in minute (n=3) method
Pyruvate 4.69 0.094 a
Lactic acid 4.79 0.086 a, b
Glycolic acid 4.99 0.079 a, b, c
Oxalate 5.62 0.074 a
Succinic acid 7.54 0.615 a, b
Glyceric acid 7.65 0.051 a, b
Fumaric acid 7.89 0.051 a, b
Malic acid 9.09 0.039 a, b, c
Aspartic acid 9.37 2.16 a, b
Pyroglutamic acid 9.47 0.04 a, b, c
Pyrogallol 9.59 0.041 a
Arabinose 10.47 0.035 a, b
Arabitol 10.9 0.034 a, b
Shikimic acid 11.57 0.032 a
Citric acid 11.68 0.031 a, b, c
Quinic acid 11.93 0.032 a
Fructose 12 0.031 a, b
Glucose 12.15 0.041 a, b
Caffeine 12.18 0.038 a, b, c
Inositol 13.5 0.028 a, b, c
Caffeic acid 13.85 0.025 a, b
Fig. 2 SAM analysis derived from Kopi Luwak (Arabica) and all Tryptophan 14.36 0.602 a, b
Octadecanoic acid 14.49 0.025 a, b
regular coffee data sets of experimental coffee set.
Sucrose 16.49 0.023 a, b
Twelve detected peaks (highlighted by green color) were Melibiose 17.33 0.025 a, b
considered significant. The list including glycolic acid, Chlorogenic acid 18.76 0.025 a
malic acid, citric acid, quinic acid and unidentified peaks. a (a = in-house library, b = NIST library, c = authentic standard)
37