
Page 13 - Shimadzu Journal vol.3 Issue2
P. 13
Metabolomics
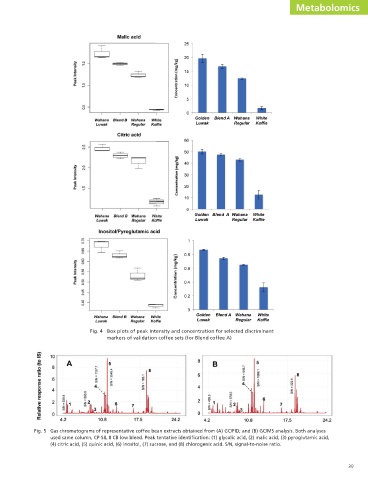
Fig. 4 Box plots of peak intensity and concentration for selected discriminant
markers of validation coffee sets (for Blend coffee A)
Fig. 5 Gas chromatograms of representative coffee bean extracts obtained from (A) GC/FID; and (B) GC/MS analysis. Both analyses
used same column, CP-SIL 8 CB low bleed. Peak tentative identification: (1) glycolic acid, (2) malic acid, (3) pyroglutamic acid,
(4) citric acid, (5) quinic acid, (6) inositol, (7) sucrose, and (8) chlorogenic acid. S/N, signal-to-noise ratio.
39