
Page 19 - Shimadzu Journal vol.3 Issue2
P. 19
Flavor Release Evaluation
1) 2) ) 3) )
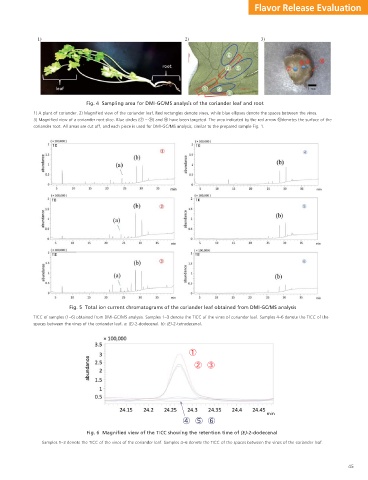
Fig. 4 Sampling area for DMI-GC/MS analysis of the coriander leaf and root
1) A plant of coriander. 2) Magnified view of the coriander leaf. Red rectangles denote vines, while blue ellipses denote the spaces between the vines.
3) Magnified view of a coriander root slice. Blue circles (ᶉ – ᶋ) and ᶌ have been targeted. The area indicated by the red arrow ᶌdenotes the surface of the
coriander root. All areas are cut off, and each piece is used for DMI-GC/MS analysis, similar to the prepared sample Fig. 1.
Fig. 5 Total ion current chromatograms of the coriander leaf obtained from DMI-GC/MS analysis
TICC of samples (1–6) obtained from DMI-GC/MS analysis. Samples 1–3 denote the TICC of the vines of coriander leaf. Samples 4–6 denote the TICC of the
spaces between the vines of the coriander leaf. a: (E)-2-dodecenal. b): (E)-2-tetradecenal.
①
②③
min
④ ⑤ ⑥
Fig. 6 Magnified view of the TICC showing the retention time of (E)-2-dodecenal
Samples 1–3 denote the TICC of the vines of the coriander leaf. Samples 4–6 denote the TICC of the spaces between the vines of the coriander leaf.
45