
Page 7 - Shimadzu SALD-7500nano
P. 7
Software Features
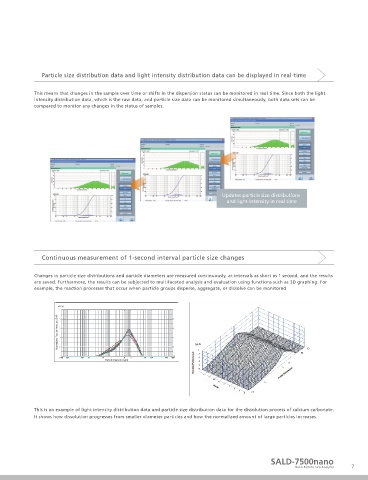
Eliminates the mistake or trouble of selecting refractive indices Particle size distribution data and light intensity distribution data can be displayed in real-time
This means that changes in the sample over time or shifts in the dispersion status can be monitored in real time. Since both the light
Automatic Refractive Index Calculation Function
intensity distribution data, which is the raw data, and particle size data can be monitored simultaneously, both data sets can be
Selecting a refractive index was an unavoidable part of using the appropriate refractive index based on the LDR (light intensity compared to monitor any changes in the status of samples.
laser diffraction method, where generally a published value was distribution reproduction) method.
entered, but such values were not necessarily appropriate, Top 5 of the refractive index candidates (from No. 1 to No. 5) are
considering the effects of particle composition and shape. displayed with the evaluation point, and the particle size
Therefore, tedious trial and error processes were used to select distribution caluculated by the refractive index is also displayed as
refractive indices. a thumbnail. An appropriate refractive index can be selected
WingSALD II solves such problems by being the world's first referring to the evaluation point and the thumbnail. The
software to include a function that automatically calculates an refractive index of the main material can be selected from the list.
Updates particle size distributions
Evaluate and light intensity in real time
Specify a range for the
refractive index
Display candidates from refractive
index and particle size calculation results
Note: The LDR method automatically calculates an appropriate refractive index based on consistency between the actual measured light intensity distribution and one
reproduced (recalculated) from particle size distribution data. This method was developed by Shimadzu and published in two technical papers. It is sometimes called Continuous measurement of 1-second interval particle size changes
the "Kinoshita Method", in academic communities, after the name of Shimadzu’s engineer.
Changes in particle size distributions and particle diameters are measured continuously, at intervals as short as 1 second, and the results
are saved. Furthermore, the results can be subjected to multifaceted analysis and evaluation using functions such as 3D graphing. For
Assist function decreases operational error to ensure more accurate measurement
example, the reaction processes that occur when particle groups disperse, aggregate, or dissolve can be monitored
Measurement Assistant Functions: allow preparing SOPs to ensure measurements are always performed using the same
conditions and procedures.
Creating, saving, and sharing measurement conditions and
procedures, including pretreatment methods and conditions,
ensures measurements are performed using the same conditions Normalized Particle Amount (Diff)
and procedures, even if performed by a different operator or at a
different location or plant, and allows safely comparing data.
Furthermore, when the measurement assistant function is used,
measurement instructions for the operator are displayed on the Particle Diameter (µm)
screen. This enables even inexperienced operators to perform
measurements correctly. In addition, administrators and operators
can be assigned different operating privileges to ensure security.
Create and save measurement
Note: SOP is an acronym for Standard Operating Procedure. conditions and procedures (SOP)
Procedures, remarks, and other information
are displayed interactively during
measurements. This standardizes measurement
procedures and prevents mistakes. This is an example of light intensity distribution data and particle size distribution data for the dissolution process of calcium carbonate.
It shows how dissolution progresses from smaller diameter particles and how the normalized amount of large particles increases.
Includes security features
that limit the functionality
available to operators
SALD-7500nano
6 Nano Particle Size Analyzer 7