
Page 17 - Shimadzu EPMA-8050G
P. 17
Options
Trace Mapping Analysis Phase Analysis
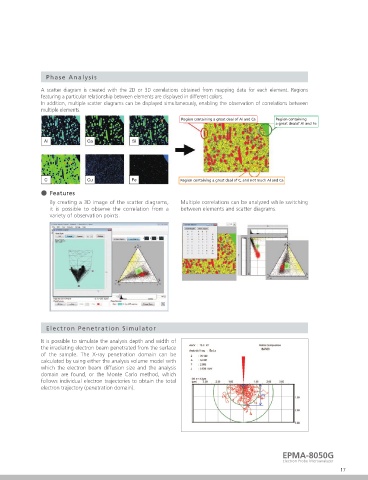
Trace functions can be added to standard mapping analysis. A scatter diagram is created with the 2D or 3D correlations obtained from mapping data for each element. Regions
For samples with surface irregularities or inclination, when featuring a particular relationship between elements are displayed in different colors.
the height changes as a function of the X-Y position, the In addition, multiple scatter diagrams can be displayed simultaneously, enabling the observation of correlations between
sample's Z axis height can be corrected, enabling multiple elements.
high-accuracy mapping analysis in which reductions in signal Region containing a great deal of Al and Ca Region containing
intensity are minimized. a great dealof Al and Fe
This feature is achieved by minutely controlling the stage’s Z
axis coordinates during the analysis, based on height data
obtained beforehand from multiple points. The trace surface
found from the con gured height data can be con rmed via
contour lines and 3D displays.
Region containing a great deal of C, and not much Al and Ca
˔ Features
By creating a 3D image of the scatter diagrams, Multiple correlations can be analyzed while switching
No trace applied Trace applied it is possible to observe the correlation from a between elements and scatter diagrams.
variety of observation points.
Illustration of the Basic Principle
˔ Mapping Analysis Results
Example of a sample 20 cent coin: Cu mapping
A more correct elemental distribution is
obtained by using the trace.
*The trace is centered on the gure and periphery. The stars and the border
are not targeted.
Topographical image No trace applied Trace applied
Trace Line Analysis Electron Penetration Simulator
As with trace mapping analysis, trace functions can It is possible to simulate the analysis depth and width of
be added to a standard line analysis. the irradiating electron beam penetrated from the surface
of the sample. The X-ray penetration domain can be
calculated by using either the analysis volume model with
which the electron beam diffusion size and the analysis
domain are found, or the Monte Carlo method, which
follows individual electron trajectories to obtain the total
electron trajectory (penetration domain).
EPMA-8050G
Electron Probe Microanalyzer
16 17