
Page 27 - Shimadzu EPMA-1720 Series
P. 27
Trace Mapping Analysis
Trace functions can be added to standard mapping analysis.
For samples with surface irregularities or inclination, when
the height changes as a function of the X–Y position, the
sample’s Z axis height can be corrected, enabling
high-accuracy mapping analysis in which reductions in
signal intensity are minimized.
This feature is achieved by minutely controlling the stage’s
Z axis coordinates during the analysis, based on height data
obtained beforehand from multiple points. The trace
surface found from the configured height data can be
confirmed via contour lines and 3D displays.
No trace applied Trace applied
Illustration of the Basic Principle
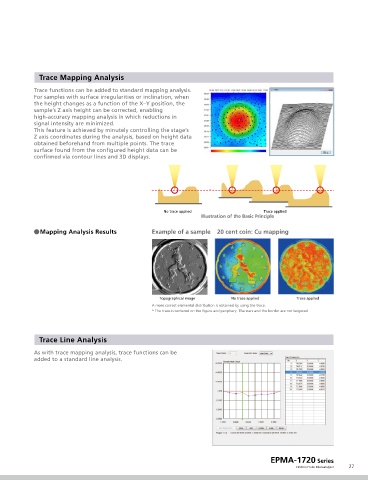
• Mapping Analysis Results Example of a sample 20 cent coin: Cu mapping
Topographical image No trace applied Trace applied
A more correct elemental distribution is obtained by using the trace.
* The trace is centered on the figure and periphery. The stars and the border are not targeted.
Trace Line Analysis
As with trace mapping analysis, trace functions can be
added to a standard line analysis.
EPMA-1720 Series
Electron Probe Microanalyzer 27