
Page 28 - Shimadzu EPMA-1720 Series
P. 28
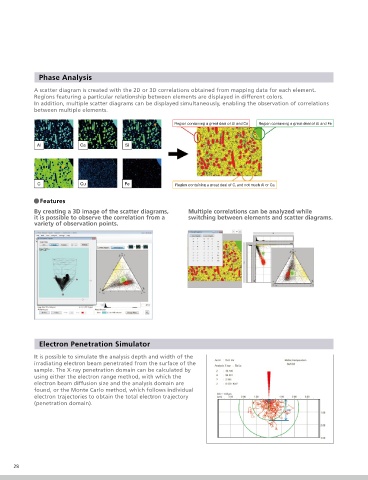
Phase Analysis

            A scatter diagram is created with the 2D or 3D correlations obtained from mapping data for each element.
            Regions featuring a particular relationship between elements are displayed in different colors.
            In addition, multiple scatter diagrams can be displayed simultaneously, enabling the observation of correlations
            between multiple elements.


             • Features
            By creating a 3D image of the scatter diagrams,    Multiple correlations can be analyzed while
            it is possible to observe the correlation from a   switching between elements and scatter diagrams.
            variety of observation points.


              Electron Penetration Simulator

            It is possible to simulate the analysis depth and width of the
            irradiating electron beam penetrated from the surface of the
            sample. The X-ray penetration domain can be calculated by
            using either the electron range method, with which the
            electron beam diffusion size and the analysis domain are
            found, or the Monte Carlo method, which follows individual
            electron trajectories to obtain the total electron trajectory
            (penetration domain).


      28