
Page 10 - Shimadzu CFT-EX Series
P. 10
global w430×h280
Viscosity Evaluation of Thermoplastic Resins (GFRP)
V iscosity Evaluation of Thermoplastic Resins (GFRP) Evaluation of Thermosetting Resins (Epoxies)
Constant Heating
oduced molded plastic pr
oducts ar
Most mass produced molded plastic products are injection-molded. The appropriate temperature and pressure for injection
Most mass pr
essur
e for injection
e and pr
e injection-molded. The appr
opriate temperatur
When thermosetting resins are heated, they melt and are able to flow, but further heating increases viscosity and
molding differs depending on the type of resin and shape of the die, where poor molding parameters could cause
molding differs depending on the type of resin and shape of the die, where poor molding parameters could cause
causes curing. The minimum viscosity value, the time it takes to reach that minimum, and the time it takes for curing
over-filling, under-filling, sink marks, voids, or other molding defects. Even if appropriate molding parameters are used, any
over-filling, under-filling, sink marks, voids, or other molding defects. Even if appropriate molding parameters are used, any
depend on the temperature used to melt the resin. Unless these viscosity and time values are appropriate for the
changes in the status of the resin raw materials used could cause molding defects. Therefore, it is important to control the
changes in the status of the resin raw materials used could cause molding defects. Therefore, it is important to control the
molding process, they can result in molding defects. For resins, characteristic values can vary between lots or due to
quality of resin raw materials on a daily basis.
other factors. Therefore, controlling the resin viscosity is very important to ensure that the characteristic values do not
Furthermore, it is important to perform the daily resin raw material control measurements under high-pressure conditions
Furthermore, it is important to perform the daily resin raw material control measurements under high-pressure conditions
vary and good products are produced.
that approximate molding conditions, which is not possible using the melt flow rate measurement method.
that approximate molding conditions, which is not possible using the melt flow rate measurement method.
V iscosity Evaluation Using Constant T emperature Method Measurement of the Minimum Melt Viscosity Value
Viscosity Evaluation Using Constant Temperature Method
Measurement Conditions
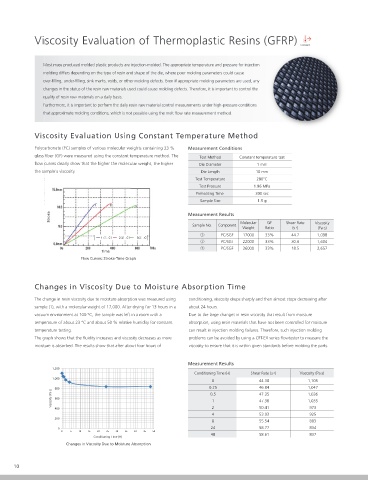
Polycarbonate (PC) samples of various molecular weights containing 33 %
Polycarbonate (PC) samples of various molecular weights containing 33 % Measurement Conditions The fluidity properties of thermosetting resins are often measured using constant Measurement Conditions
glass fiber (GF) were measured using the constant temperature method. The
glass fiber (GF) wer e measur ed using the constant temperatur e method. The Test Method Constant temperature test temperature testing. Unlike thermoplastic resins, the thermoset viscosity is constantly Test Method Constant temperature test
Test Method
Constant temperature test
flow curves clearly show that the higher the molecular weight, the higher
flow curves clearly show that the higher the molecular weight, the higher Die DiameterDie Diameter 1 mm changing. Therefore, the minimum melt viscosity value can be determined Die Diameter 0.5 mm
1 mm
the sample's viscosity. Die LengthDie Length 10 mm automatically by using automatic constant temperature testing. Die Length 10 mm
10 mm
Test Temperature 185°C
280°C
Test TemperatureTest Temperature 280°C Test Pressure 2.45 MPa
Test PressureTest Pressure 1.96 MPa In this case, three types of thermosetting resins were tested using the constant Preheating Time 15 sec
1.96 MPa
300 sec
Preheating Time
Preheating Time 300 sec temperature method. The testing pressure was selected so that the sample Sample Size 2.5 g (formed into pellets)
Sample Size 1.5 g would melt and flow and then stop flowing due to curing.
1.5 g
Sample Size
Stroke Measurement Results The viscosity-time graph, which shows the change in viscosity over time,
Measurement Results
Sample No. Component Molecular GF Shear Rate Viscosity indicates that the sample melts and starts to flow after about 3 seconds, Measurement Results
Weight Ratio (s -1 ) (Pa·s) reaches its minimum viscosity after about 10 seconds, and then stops Sample No. Shear Rate (s -1 ) Viscosity (Pa·s)
PC/SGF 17000 33% 44.7 1,098
1: . C1 2: . C1 3: . C1 flowing after about 18 seconds. 1 2,471 12.4
PC/SGF 22000 33% 30.6 1,604
2 4,073 7.5
PC/SGF 26000 33% 18.5 2,657
Time The CFT calculates viscosity by measuring the amount of piston movement 3 5,810 5.3
Flow Curves: Stroke-Time Graph (movement speed) during constant test force extrusion. Therefore, even when the
sample cures due to heating, the piston displacement merely stops, which has no
effect on controlling the test force. Consequently, it provides extremely stable and
highly reproducible test data.
Changes in Viscosity Due to Moisture Absorption Time
The change in resin viscosity due to moisture absorption was measured using conditioning, viscosity drops sharply and then almost stops decreasing after
sample (1), with a molecular weight of 17,000. After drying for 13 hours in a about 24 hours.
vacuum environment at 100 °C, the sample was left in a room with a Due to the large changes in resin viscosity that result from moisture
temperature of about 23 °C and about 50 % relative humidity for constant absorption, using resin materials that have not been controlled for moisture
temperature testing. can result in injection molding failures. Therefore, such injection molding Viscosity Stroke
The graph shows that the fluidity increases and viscosity decreases as more problems can be avoided by using a CFT-EX series flowtester to measure the
moisture is absorbed. The results show that after about four hours of viscosity to ensure that it is within given standards before molding the parts.
No1. C1 No2. C1 No3. C1 1:No1. C1 2:No2. C1 3:No3. C1
Measurement Results
1,200 Time Time
Conditioning Time (H) Shear Rate (s -1 ) Viscosity (Pa·s) Viscosity-Time Graph Stroke-Time Graph
1,000
0 44.38 1,105
800 0.25 46.84 1,047
Viscosity (Pa·s) 600 0.5 47.35 1,036 A Split Nozzle Makes Cleaning Easy
1
47.38
1,035
400 2 50.41 973 Due to the relatively low minimum melt viscosity and high fluidity of thermosetting
resins, long nozzles with small hole diameters are often used. Therefore, it can be
4 53.03 925
200 difficult to remove the residual resin inside the nozzle once the resin has cured after
8 55.54 883
measurements.
0 24 58.77 834 However, using a split nozzle, which splits into two halves down its center, allows easy
0 5 10 15 20 25 30 35 40 45 50
48 58.61 837
Conditioning Time (H) removal of the resin, thereby enabling more efficient cleaning and measuring.
Changes in Viscosity Due to Moisture Absorption
CFT-EX Series
10 Capillary Rheometer Flowtester 11