Page 6 - Shimadzu CFT-EX Series
P. 6

global w430×h280


                    Natural, Easy Test Flow


                    The software, which is configured to match the operation flow, offers a smooth progression through setting of conditions, starting and stopping   Higher Level Evaluation Using a Variety of Analysis Methods
                    the test, data acquisition, data storage, and reanalysis of stored data.
                                                                                                                                              Along with enhanced analysis functions, many graph generation and overlay functions as well as a zoom feature are included. Bagley viscosity correction
                                                                                                                                              and calculation of shear sensitivity (shear stress/shear rate) allows estimation of molecular weight distribution.
                    Setting Up Test Conditions to Storing Data - All on a Single Window

                    All operations associated with selecting the test method (either constant temperature or constant heating rate method), setting of test conditions, and output   Reanalysis of Test Data
                    from test start to test results can be accomplished effortlessly. Data is automatically saved, and can be re-analyzed at any time after the test using off-line
                                                                                                                                              After setting a calculation interval based on the stroke or time (temperature), the
                    software.
                                                                                                                                              viscosity/shear rate can be determined for that interval. The graph can accommodate
                                                                                                                                              up to ten overlaid files, and the pointer can be used to zoom in on any designated
                                                                                                                                              region of the graph.
                                       Select
                                     measurement    Enter test    Start test   Test results    Report/
                                      method       conditions                  (Auto save)    Analysis                                            Constant Temperature
                                                                                                                                                               Method                      Recalculation


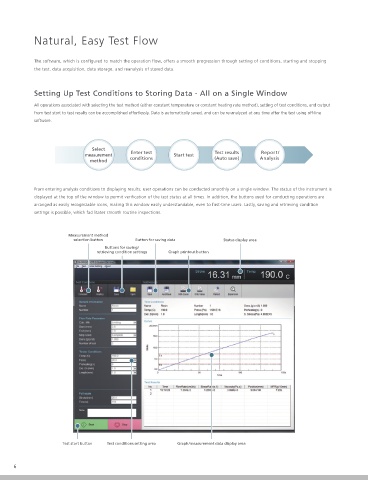
                    From entering analysis conditions to displaying results, user operations can be conducted smoothly on a single window. The status of the instrument is
                    displayed at the top of the window to permit verification of the test status at all times. In addition, the buttons used for conducting operations are   Constant Heating Rate  Recalculation
                    arranged as easily recognizable icons, making this window easily understandable, even to first-time users. Lastly, saving and retrieving condition   Method
                    settings is possible, which facilitates smooth routine inspections.


                                                                                                                                              Create a Variety of Graphs for More Detailed Data Analysis
                               Measurement method
                                 selection button    Button for saving data       Status display area
                                                                                                                                              Display stored test data files, and automatically create graphs by selecting the        Constant Temperature
                                           Buttons for saving/                                                                                                                                                                        Method:
                                        retrieving condition settings  Graph printout button                                                  graph menu.                                                                             Viscosity-Time Graph
                                                                                                                                                                           Graph Menu


                                                                                                                                                                                                      Constant Heating Rate Method:
                                                                                                                                                                                                      Shear Rate-Temperature Graph


                                                                                                                                              Advanced Analysis Using Viscosity Correction
                                                                                                                                              Shear stress, shear rate and viscosity measured by a capillary rheometer are
                                                                                                                                              calculated by ignoring the pressure loss that occurs at the exit and entrance of
                                                                                                                                              the die. With the CFT, it is possible to obtain more accurate data using the Bagley
                                                                                                                                              viscosity correction plot (a tube length correction method which assumes that the
                                                                                                                                              die length has been extended for pressure correction).


                             Test start button  Test conditions setting area  Graph/measurement data display area

                                                                                                                                                                                                                               CFT-EX Series
             6                                                                                                                                                                                                                   Capillary Rheometer Flowtester  7
   1   2   3   4   5   6   7   8   9   10   11