Page 10 - Oligonucleotide Therapeutics Solution Guide
P. 10

Characteristic analysis
                  Quality Control

                     Tm Analysis                                                                                                        UV-2600i+TMSPC-8


                                                                                                                                           Features
                                  Tm Analysis of Nucleic Acid Drugs                                                                     Tm analysis system, TMSPC-8, is connected to a spectrophotometer and measures the Tm of oligonucleotides by heating and cooling. The rate of   Modification
                                                                                                                                        temperature increasing/decreasing can be selected from 12 levels of ± 0.1, 0.2, 0.5, 1, 2 and 5 °C. There are 2 types of 8 micro-multi-cells with
                                                                                                                                        optical path length of 10 mm (minimum sample volume of 100 μL) and 1 mm (minimum sample volume of 10 μL), and these cells allow to measure   Target selection
                                                                                                 click here                             8 types of samples simultaneously in parallel.


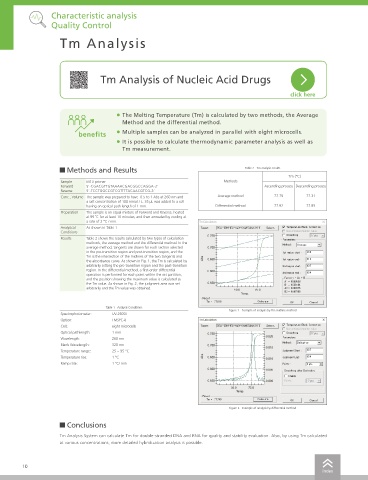
                                        •    The Melting Temperature (Tm) is calculated by two methods, the Average
                                          Method and the differential method.
                           benefits     •    Multiple samples can be analyzed in parallel with eight microcells.
                                        •    It is possible to calculate thermodynamic parameter analysis as well as                                                                                                                         Excision
                                          Tm measurement.                                                                                                                                                                                  Unprotected  Oligomer synthesis


                        Methods and Results                                       Table 2   Tm analysis results
                                                                                                 Tm (°C)
                     Sample   M13 primer                                   Methods                                                         Tm Analysis Software
                     Forward    5’-CGACGTTGTAAAACGACGGCCAGGA-3’                          Ascending process Descending process
                     Reverse  5‘-TCCTGGCCGTCGTTTTACAACGTCG-3’                                                                           As shown in Fig. 3, a typical melting curve has a region corresponding to a double-stranded or single-stranded structure at the low temperature side
                     Conc., Volume The sample was prepared to have  0.5 to 1 Abs at 260 nm and   Average method  77.75  77.31           (pre-transition region) and at the high temperature side (post-transition region)
                              a salt concentration of 100 mmol / L. 35 µL was added to a cell
                              having an optical path length of 1 mm.    Differential method  77.92    77.85                             with a transition region where the absorbance varies greatly. Tm is defined as
                     Preparation  The sample is an equal mixture of Forword and Reverse, heated                                         the temperature at which the mole fractions of the double and single strands   Pretransition   Transition region  Post transition
                              at 95 ˚C for at least 10 minutes, and then annealed by cooling at                                         are equal.                                            region                region
                              a rate of 2 °C / min.                                                                                                                                                                                        Purification
                                                                                                                                                                                                            Tm
                     Analytical   As shown in Table 1                                                                                   One way to calculate Tm from a melting curve is called the average method.
                     Conditions
                                                                                                                                        The baselines (tangents) in the pre- and post-transition regions are determined
                     Results  Table 2 shows the results calculated by two types of calculation
                              methods, the average method and the differential method. In the                                           by the least squares method, and the intersection point between the median   Double strand
                              average method, tangents are drawn for each section selected                                              line of the two tangents and the absorbance curve is the Tm. For more details   Abs at 260 nm
                              in the pre-transition region and post-transition region, and the                                          on this method, refer to "The Average Method Analysis" below. In addition,
                              Tm is the intersection of the midlines of the two tangents and                                                                                                                        Single strand
                              the absorbance curve. As shown in Fig. 1, the Tm is calculated by                                         the method of calculating the first derivative of each point in the specified
                              arbitrarily setting the pre-transition region and the post-transition                                     temperature range for the absorbance curve, and setting the Tm value as the
                              region. In the differential method, a first-order differential                                            maximum value of the first derivative is called the differential method.
                              operation is performed for each point within the set partition,
                              and the position showing the maximum value is calculated as
                              the Tm value. As shown in Fig. 2, the judgment area was set                                               The Tm analysis software calculates the Tm. In the average method, the Tm is   Temperature
                              arbitrarily and the Tm value was obtained.                                                                calculated by setting a total of four points of the start point and the end point
                                                                                                                                                                                                      Figure 3   Example of  Melting curve
                                                                                                                                        of the baseline in each of the before transition region and the after transition                   Quality Control
                                                                                                                                        region.                                                                                              Characteristic analysis
                                    Table 1   Analysis Conditions
                                                                             Figure 1   Example of analysis by the midline method
                     Spectrophotometer:  UV-2600i                                                                                       The differential method calculates the Tm by setting the range of the temperature region. Since the absorbance changes depending on the
                     Option:          TMSPC-8                                                                                           temperature even when measuring only the buffer solution, this software has a temperature blank correction function that subtracts the buffer
                     Cell:            eight microcells                                                                                  solution data from the data of the sample in advance. In order to further improve the accuracy of the analysis, it is also equipped with a two-
                     Optical pathlength:  1 mm                                                                                          wavelength correction function that determines the difference in absorbance by measuring at any two wavelengths.
                     Wavelength:      260 nm
                                                                                                                                           The Average Method Analysis
                     Blank Wavelength:  320 nm
                     Temperature range:  25 ~ 95 °C                                                                                                                                                                                        DDS
                     Temperature rise:  1 °C                                                                                            The average method is analyzed on the assumption that a simple two-state equilibrium relationship is established between the duplex and the
                     Ramp rate:       1 °C/ min                                                                                         single strand. The absorbance can be expressed by the following equation, where ε ds  and ε ss  are the molar molecular absorption coefficients of the
                                                                                                                                        double and single chains, respectively.                                                              Pharmacokinetics
                                                                                                                                                                           Abs = ( ε ds α + ε ss (1-α )) CL
                                                                                                                                        C is the total strands concentration, L is the optical path length, and α is the mole fraction of the duplex. Tm is defined as the temperature at which
                                                                                                                                        alpha equals 1/2. In strict two-state treatment, ε ds  and ε ss  have constant values regardless of temperature, but they are not actually constant values
                                                                                                                                        and change in proportion to temperature (T), so it is necessary to introduce a term proportional to T.
                                                                             Figure 2   Example of analysis by differential method                                         ε ds   = a ds   + b ds T ε ss  = a ss  + b ss T
                                                                                                                                        The Tm analysis software uses these equations to calculate Tm values as follows:.
                        Conclusions                                                                                                     1.The user determines a start point and an end point of the baseline in the forward transition region and the backward transition region.  Other
                                                                                                                                        2.The software automatically calculates ads, bds, and bss by regression calculation.
                     Tm Analysis System can calculate Tm for double-stranded DNA and RNA for quality and stability evaluation. Also, by using Tm calculated
                                                                                                                                        3. The software automatically calculates the midline between these two baselines and calculates the intersection of the midline and the absorbance
                     at various concentrations, more detailed hybridization analysis is possible.                                         curve as the Tm value.


        10                                                                                                                                                                                                                                  11
                                                                                                            index                                                                                                                  index
   5   6   7   8   9   10   11   12   13   14   15