Page 17 - Microorganism Species Analysis
P. 17

MALDI-TOF MS                                                                                                                                                                                                         MALDI-TOF MS
                                          Direct Measurements of Microorganism-Derived Components
            Microorganism Solutions                                                                                                                                                                                              Microorganism Solutions


                      Data                                                                                                                Data


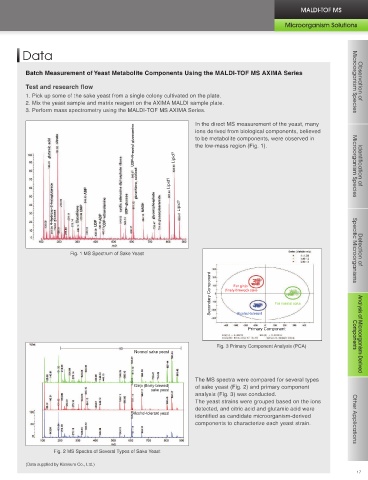
                        Measurements of Peptides                                                                                           Batch Measurement of Yeast Metabolite Components Using the MALDI-TOF MS AXIMA Series
                        Fig. 1 shows the MS spectrum of Katanosin B-producing bacteria. m/z 1277 is the protonated molecule of Katanosin                                                                                                               Microorganism Species  Observation of
                                                                                                                                           Test and research flow
                        B. Fig. 2 shows the MS/MS spectrum of Katanosin B.
                                                                                                                                           1. Pick up some of the sake yeast from a single colony cultivated on the plate.
            Observation of
                        By measuring directly from the bacteria, MALDI-TOF MS allows simple, high-throughput assays of Katanosin           2. Mix the yeast sample and matrix reagent on the AXIMA MALDI sample plate.
                        B-producing bacteria.                                                                                              3. Perform mass spectrometry using the MALDI-TOF MS AXIMA Series.
          Microorganism Species
                                                                                                                                                                                                   In the direct MS measurement of the yeast, many
                                                                                                                                                                                                   ions derived from biological components, believed
                                                                                                                                                                                                   to be metabolite components, were observed in
                                                                                                                                                                                                   the low-mass region (Fig. 1).
                                                                                                                                                                                            Lipid?                                                     Microorganism Species  Identification of


                                                                                                                                                                                          Lipid?
                                                     Structure of Katanosin B
            Identification of
          Microorganism Species
                                                                                                                                                                                              Lipid?


                              Fig. 1 MS Spectrum of Katanosin B-Producing Bacteria


                                                                              Fig. 2 MS/MS Spectrum of Katanosin B (m/z 1277)                            Fig. 1 MS Spectrum of Sake Yeast                                                              Specific Microorganisms  Detection of

            Detection of
                                                                                                                                                                                                        Secondary Component
          Specific Microorganisms
                                                                                                                                                                                                               For ginjo
                        Measurement of Lipids                                                                                                                                                                (finely-brewed) sake
                        Fig. 1 shows the MS spectrum of Mould A.                                                                                                                                                             For normal sake
                        Fig. 2 shows the MS/MS spectrum with the m/z 804 precursor ion. The m/z 804 peak in the MS/MS spectrum is
                        estimated to be phosphatidylcholine (1-acyl-2-acyl 18:2-18:2).                                                                                                                           Alcohol-tolerant

                        Lipids conventionally analyzed through extraction by organic solvent and analysis by chromatography can be                                                                                  Primary Component
                        performed by direct measurement of the mould.                                                                                                                                                                                  Components  Analysis of Microorganism-Derived
                                                                                                                                                                                                          Fig. 3 Primary Component Analysis (PCA)
          Components
                                                                                                                                                                               Normal sake yeast


            Analysis of Microorganism-Derived
                                                                                                                                                                                                   The MS spectra were compared for several types
                                                                                                                                                                               Ginjo (finely-brewed)  of sake yeast (Fig. 2) and primary component
                                                                                                                                                                                     sake yeast
                                                                                                                                                                                                   analysis (Fig. 3) was conducted.
                                                                                                                                                                                                   The yeast strains were grouped based on the ions
                                                          Mould A strain                                                                                                                           detected, and citric acid and glutamic acid were
                                                                                                                                                                              Alcohol-tolerant yeast
                                                                                                                                                                                                   identified as candidate microorganism-derived       Other Applications
                                                                                                                                                                                                   components to characterize each yeast strain.


                                    Fig. 1 MS Spectrum of Mould A                  Fig. 2 m/z 804 MS/MS Spectrum
          Other Applications
                                                                                                                                                    Fig. 2 MS Spectra of Several Types of Sake Yeast
                        (Data supplied by Prof. S. Shimizu and Assistant Professor E. Sakuradani, Graduate School of Agriculture, Kyoto University)   (Data supplied by Kizakura Co., Ltd.)
          16                                                                                                                                                                                                                                            17
   12   13   14   15   16   17   18   19   20   21   22