
Page 64 - Application Handbook - TOC
P. 64
SCA-130-507
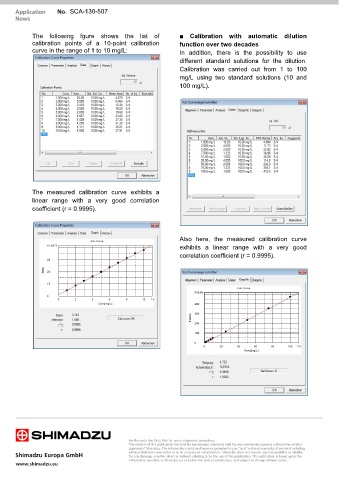
The following fgure shows the list of ■ Calibration with automatic dilution
calibration points of a 10-point calibration function over two decades
curve in the range of 1 to 10 mg/L: In addition, there is the possibility to use
different standard solutions for the dilution.
Calibration was carried out from 1 to 100
mg/L using two standard solutions (10 and
100 mg/L).
The measured calibration curve exhibits a
linear range with a very good correlation
coefficient (r = 0.9995).
Also here, the measured calibration curve
exhibits a linear range with a very good
correlation coefficient (r = 0.9995).