Page 103 - Application Handbook - Liquid Chromatography
P. 103

Application  No.L456
    News

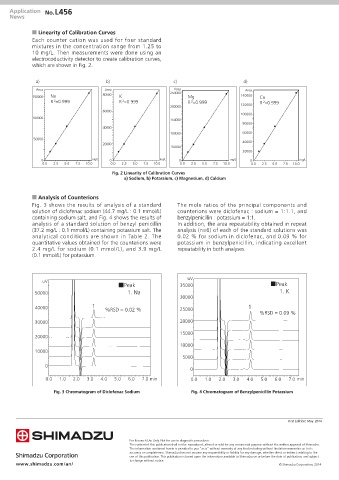
            n Linearity of Calibration Curves
            Each counter cation was used for four standard
            mixtures in the concentration range from 1.25 to
            10 mg/L. Then measurements were done using an
            electrocoductivity detector to create calibration curves,
            which are shown in Fig. 2.

              a)                      b)                      c)                       d)
                                                              Area
              Area                    Area                   250000                    Area
            150000  Na               80000  K                      Mg                 140000  Ca
                   R =0.999                R =0.999                R =0.999                 R =0.999
                    2
                                            2
                                                                    2
                                                                                             2
                                                             200000                   120000
                                     60000
                                                                                      100000
            100000
                                                             150000
                                                                                      80000
                                     40000
                                                             100000                   60000
             50000
                                     20000                                            40000
                                                             50000
                                                                                      20000
                0                mg/L   0                mg/L   0                 mg/L   0                mg/L
                0.0  2.5  5.0  7.5  10.0  0.0  2.5  5.0  7.5  10.0  0.0  2.5  5.0  7.5  10.0  0.0  2.5  5.0  7.5  10.0
                                        Fig. 2  Linearity of Calibration Curves
                                             a) Sodium, b) Potassium, c) Magnesium, d) Calcium
            n Analysis of Counterions
            Fig. 3 shows the results of analysis of a standard   The mole ratios of the principal components and
            solution of diclofenac sodium (44.7 mg/L : 0.1 mmol/L)   counterions were diclofenac : sodium = 1:1.1, and
            containing sodium salt, and Fig. 4 shows the results of   benzylpenicillin : potassium = 1:1.
            analysis of a standard solution of benzyl penicillin   In addition, the area repeatability obtained in repeat
            (37.2 mg/L : 0.1 mmol/L) containing potassium salt. The   analysis (n=6) of each of the standard solutions was
            analytical conditions are shown in Table 2. The    0.02 % for sodium in diclofenac, and 0.09 % for
            quantitative values obtained for the counterions were   potassium in benzylpenicillin, indicating excellent
            2.4 mg/L for sodium (0.1 mmol/L), and 3.9 mg/L     repeatability in both analyses.
            (0.1 mmol/L) for potassium.


                                                                   uV
                uV
                                           ˙Peak                35000                           ˙Peak
             50000                            1. Na                                                1. K
                                                                30000
             40000               1    %RSD = 0.02 %             25000                   1
                                                                                            %RSD = 0.09 %
             30000                                              20000
                                                                15000
             20000
                                                                10000
             10000
                                                                 5000
                 0
                                                                    0
                 0.0  1.0  2.0  3.0  4.0  5.0  6.0  7.0 min         0.0  1.0  2.0  3.0  4.0  5.0  6.0  7.0 min

                    Fig. 3 Chromatogram of Diclofenac Sodium        Fig. 4 Chromatogram of Benzylpenicillin Potassium


                                                                                                      First Edition: May. 2014


                                               For Research Use Only. Not for use in diagnostic procedures.
                                               The content of this publication shall not be reproduced, altered or sold for any commercial purpose without the written approval of Shimadzu.
                                               The information contained herein is provided to you "as is" without warranty of any kind including without limitation warranties as to its
                                               accuracy or completeness. Shimadzu does not assume any responsibility or liability for any damage, whether direct or indirect, relating to the
                                               use of this publication. This publication is based upon the information available to Shimadzu on or before the date of publication, and subject
                                               to change without notice.
       www.shimadzu.com/an/                                                                        © Shimadzu Corporation, 2014
   98   99   100   101   102   103   104   105   106   107   108